Silver Fell 6% in a Day. Gold Finished the Week Flat.
Hot September CPI sent silver down 6.2% in a day while gold ended the week nearly flat. Why the two metals split, and what it means for stacking plans.
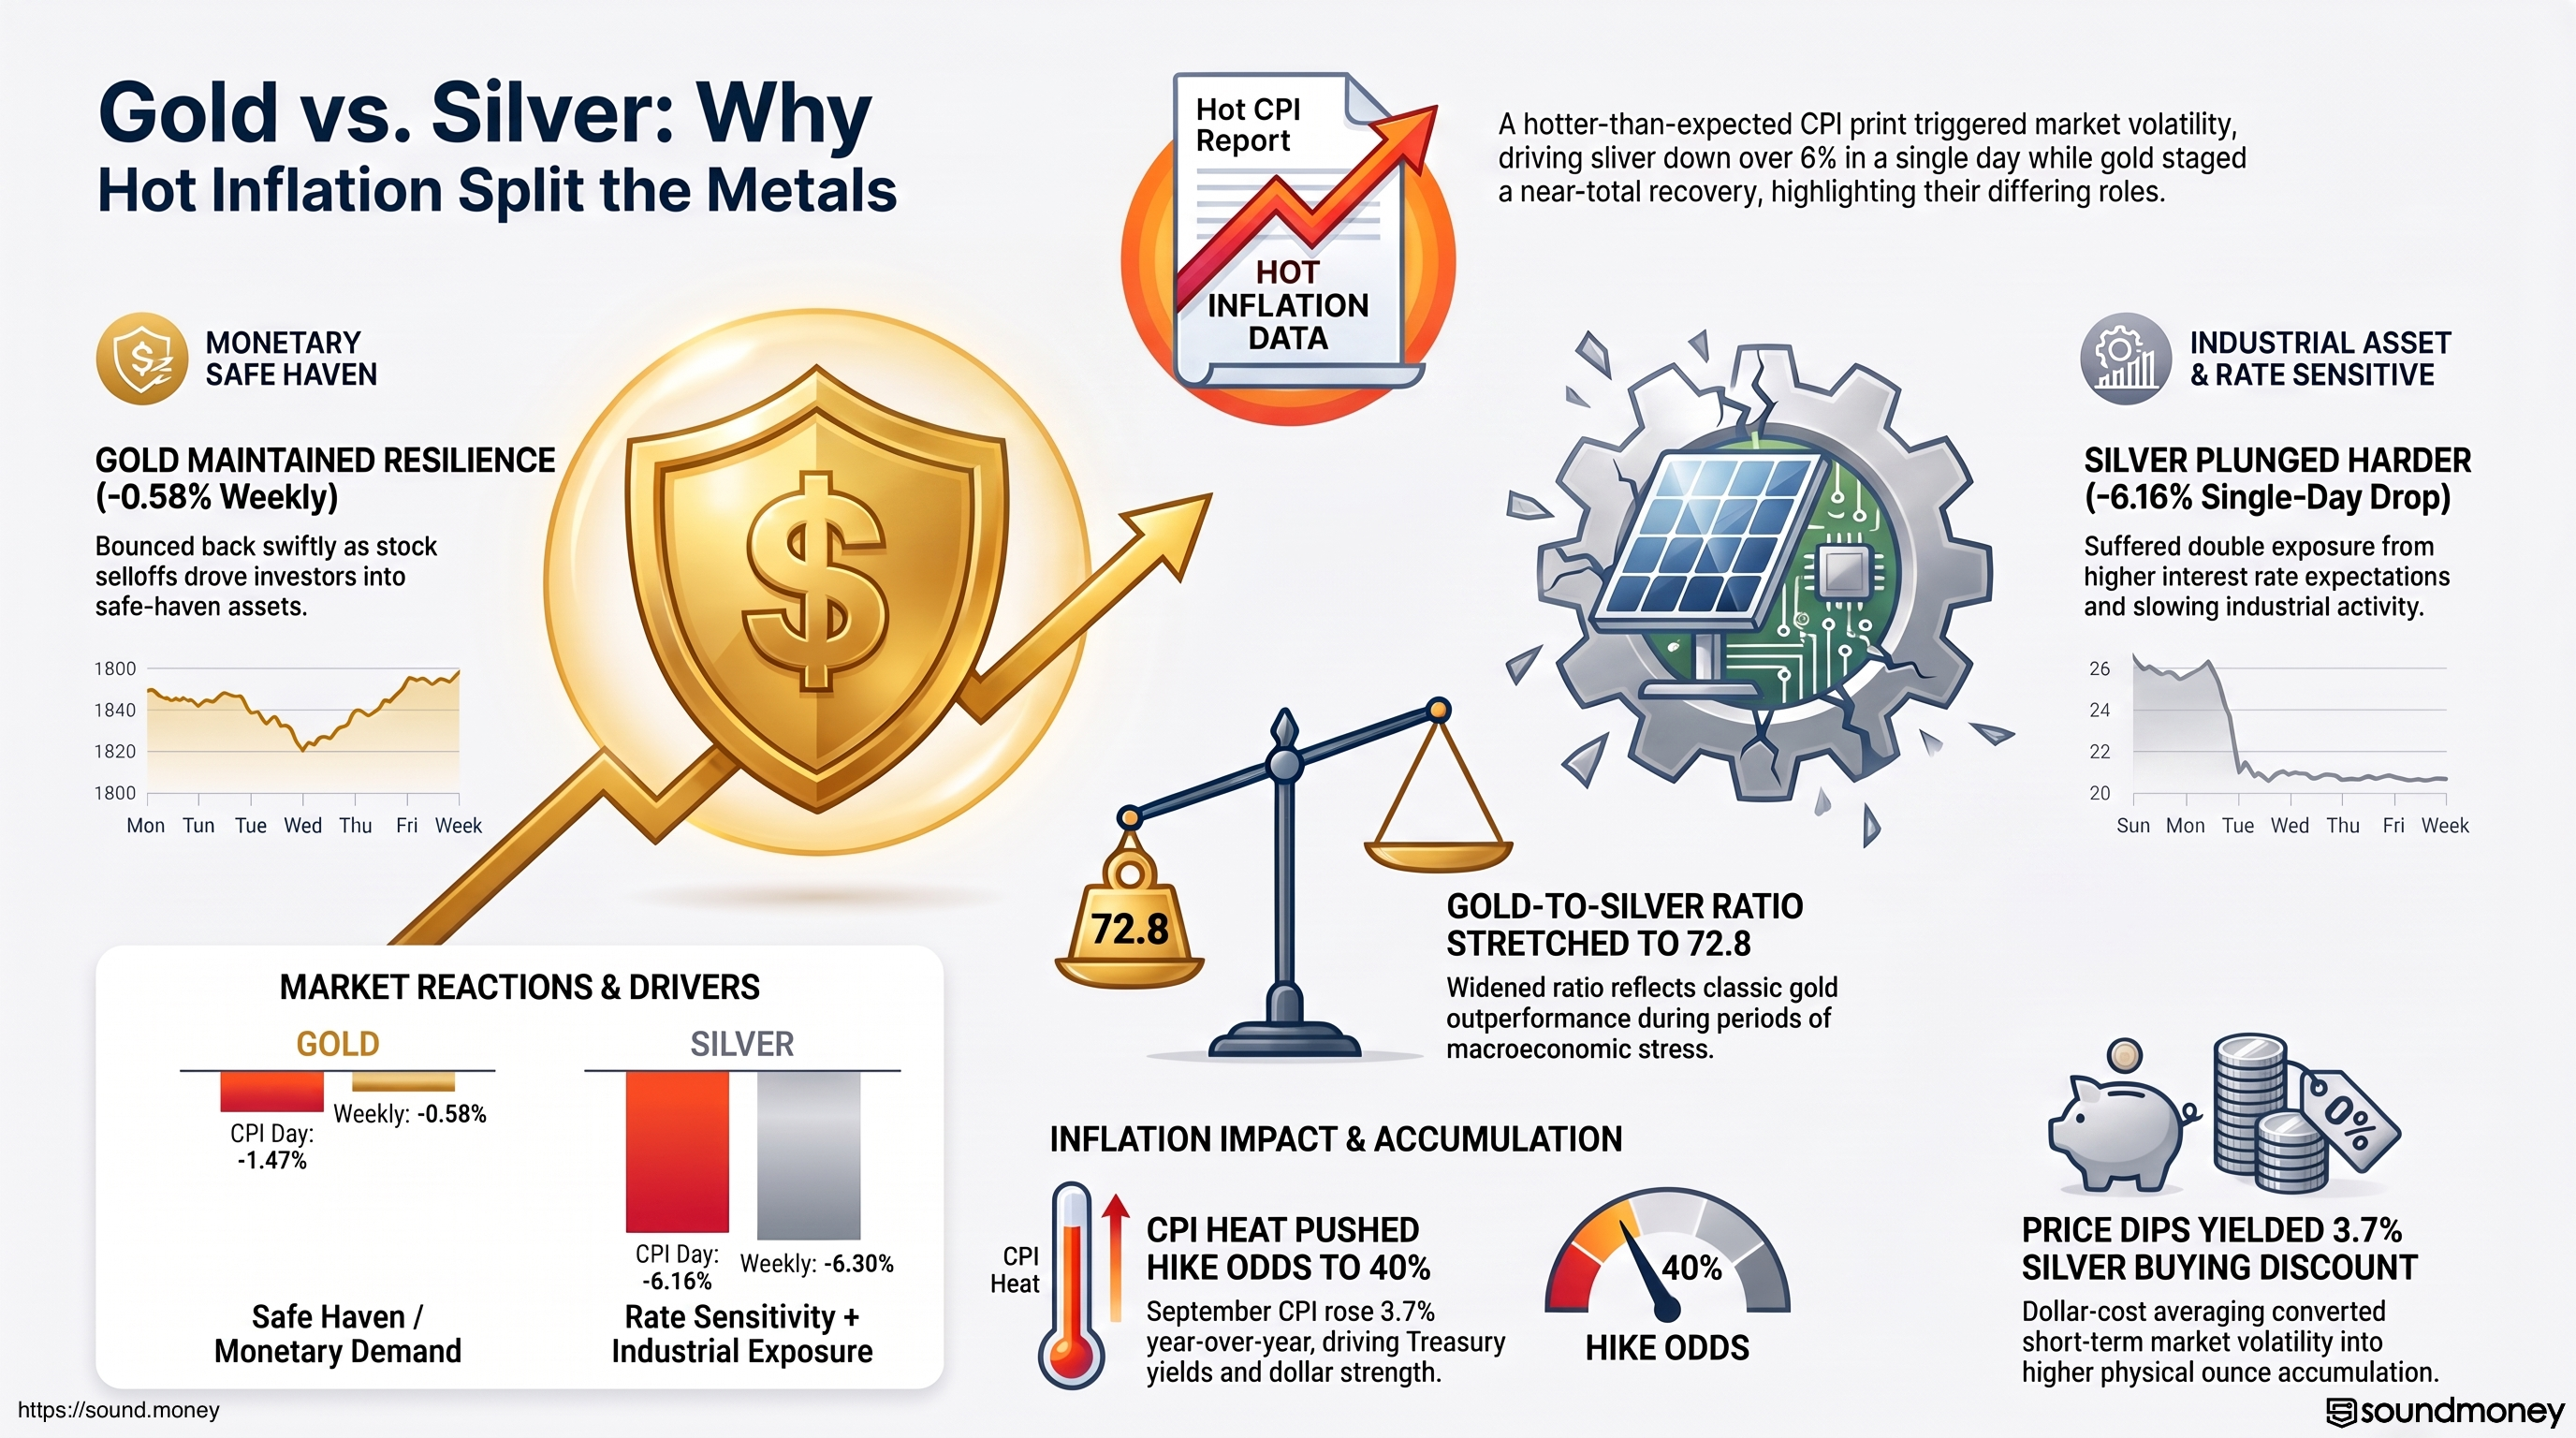
Last Wednesday delivered one of the sharpest single-day splits between gold and silver we have seen all year. The September CPI report came in hot, and by late trading silver was down 6.16% to $55.41 while gold was down 1.47% at $4,098.80. Two metals, one inflation print, very different bruises.
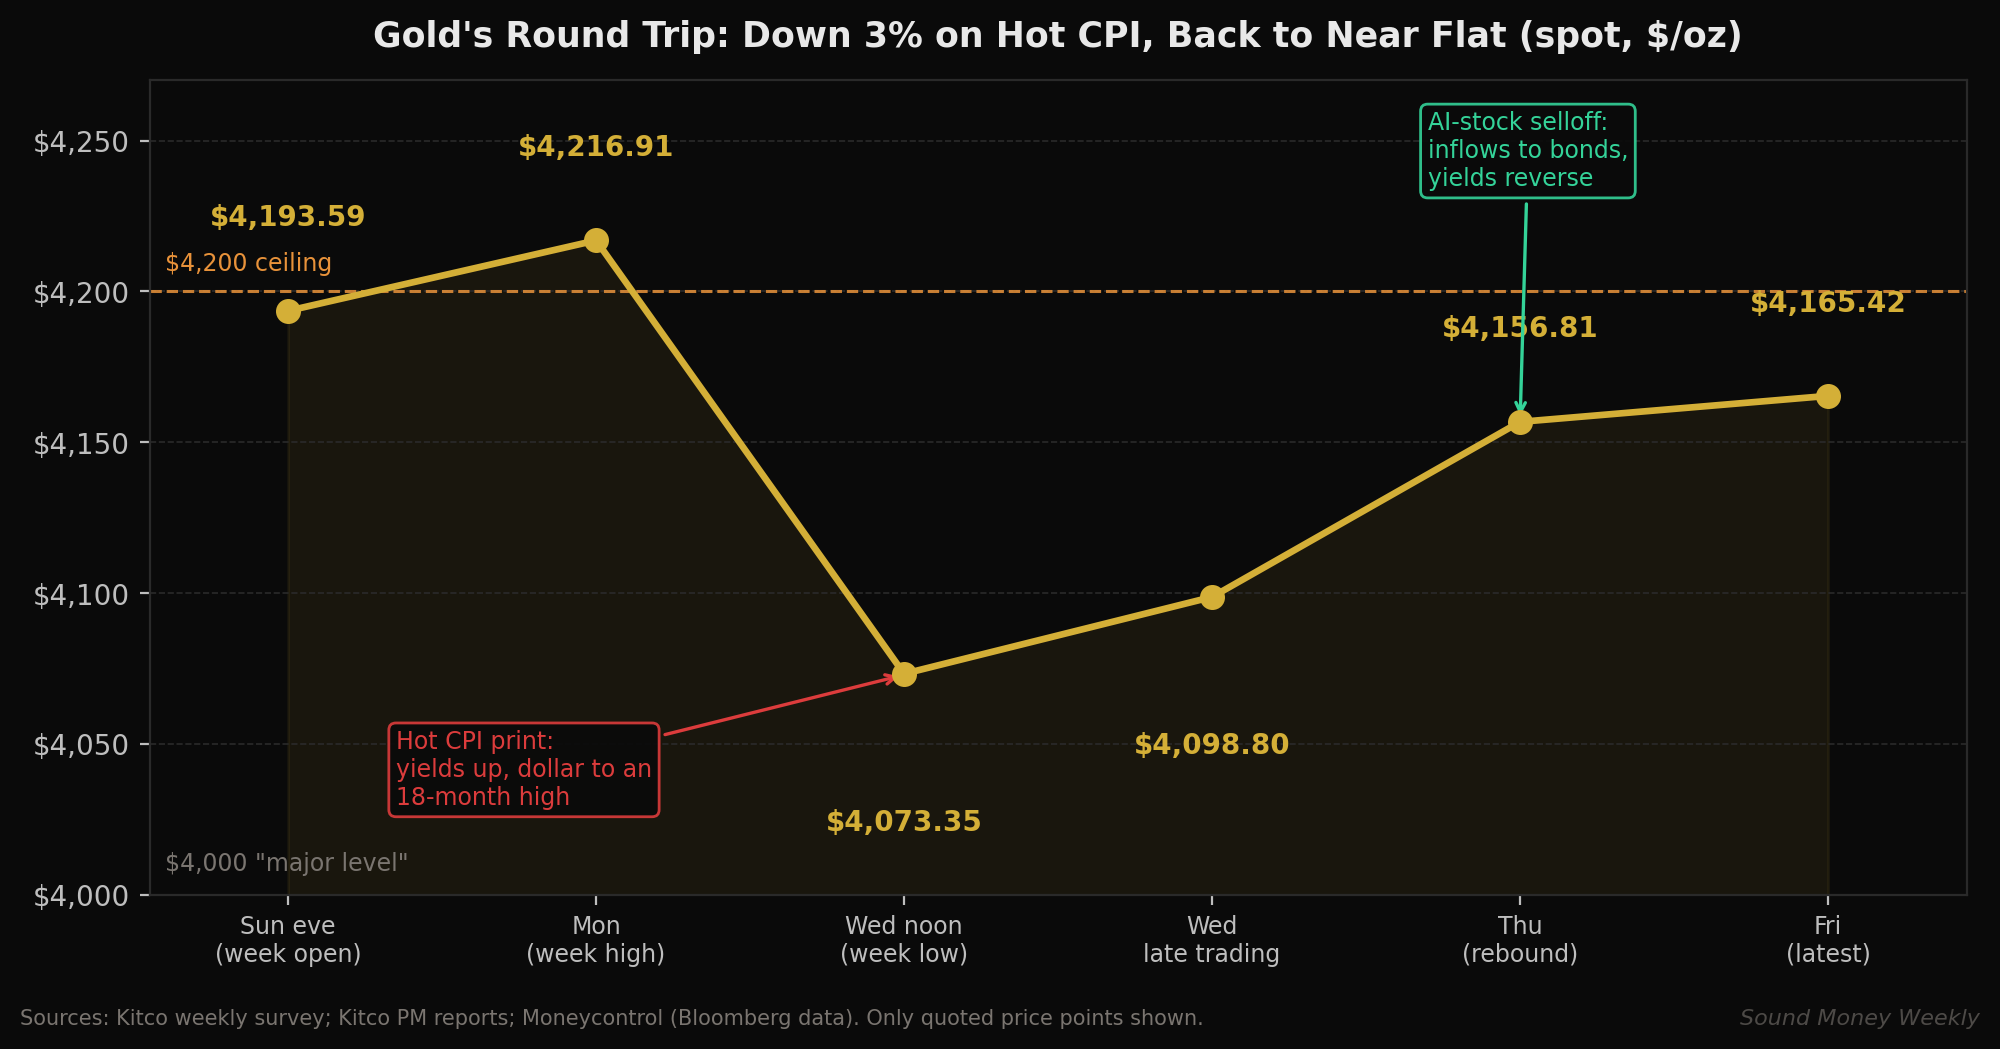
Then came the twist. By Friday's close, gold had recovered to $4,165.42 — down just 0.58% for the week. Silver ended near $57, down about 6.3% from the prior Friday's $60.77 close. This morning (October 19, as of 3:47 a.m. ET) gold is at $4,181.60 and silver at $57.46.
The week's lesson is not about inflation. It is about what gold and silver actually are when markets get stressed — and the data made the distinction unusually clear.
The Story
Wednesday: the hot print
September CPI rose 0.6% on the month and 3.7% year over year, ahead of the 3.6% forecast, with core CPI up 0.3% monthly and 2.6% annually — up from 2.4% in August. Gasoline drove more than half the monthly jump. The same day, the Fed's Beige Book reported price increases accelerating in four districts and fuel-related cost pressure described as widespread.
Markets repriced fast. The two-year Treasury yield jumped 14 basis points to 4.93%, the 10-year rose 10 basis points to 5.314%, and the dollar index climbed 0.55% to an 18-month high. Odds of an October Fed hike roughly doubled — Kitco reported them rising from about 20% before the report to nearly 40% after it, and Reuters showed implied odds briefly near a coin flip. Gold slid below $4,100; silver plunged.
Thursday: the haven twist
On Thursday, a tech-driven equity selloff sent investors into bonds, and Treasury yields "largely reversed" Wednesday's spike, as Bloomberg data via Moneycontrol reported. Gold rose as much as 1.4%, recouping nearly all of the previous session's losses. Here is the counterintuitive part: the same inflation report that knocked gold down on Wednesday helped lift it on Thursday — because the AI-stock rout pushed investors toward Treasuries, and lower yields are gold's friend. OCBC strategist Christopher Wong described bond yields as "on a rollercoaster," having "revers[ed] the earlier surge entirely."
Chicago Fed President Austan Goolsbee called the inflation data "discouraging" and suggested the AI infrastructure buildout "may also be overheating the economy." Fed Chair Kevin Warsh was due to speak late Thursday at the IMF meetings in Bangkok, ahead of the Fed's blackout period before the October 27–28 meeting.
Friday: a quiet close
Gold held near $4,170 Friday as December tightening stayed in play, and finished the week marginally lower. The Kitco survey found Wall Street genuinely undecided: of 12 analysts, 4 bullish (33%), 2 bearish (17%), and 6 neutral (50%) — with Main Street voters slightly bearish. James Stanley at Forex.com said the "$4k level in spot remains the major level of note," while Adrian Day expected "some more back and forth before gold breaks out," adding "It is coming soon, however."
Under the Hood
One print, two metals
The cleanest way to see the week is the cross-asset snapshot of CPI day itself:
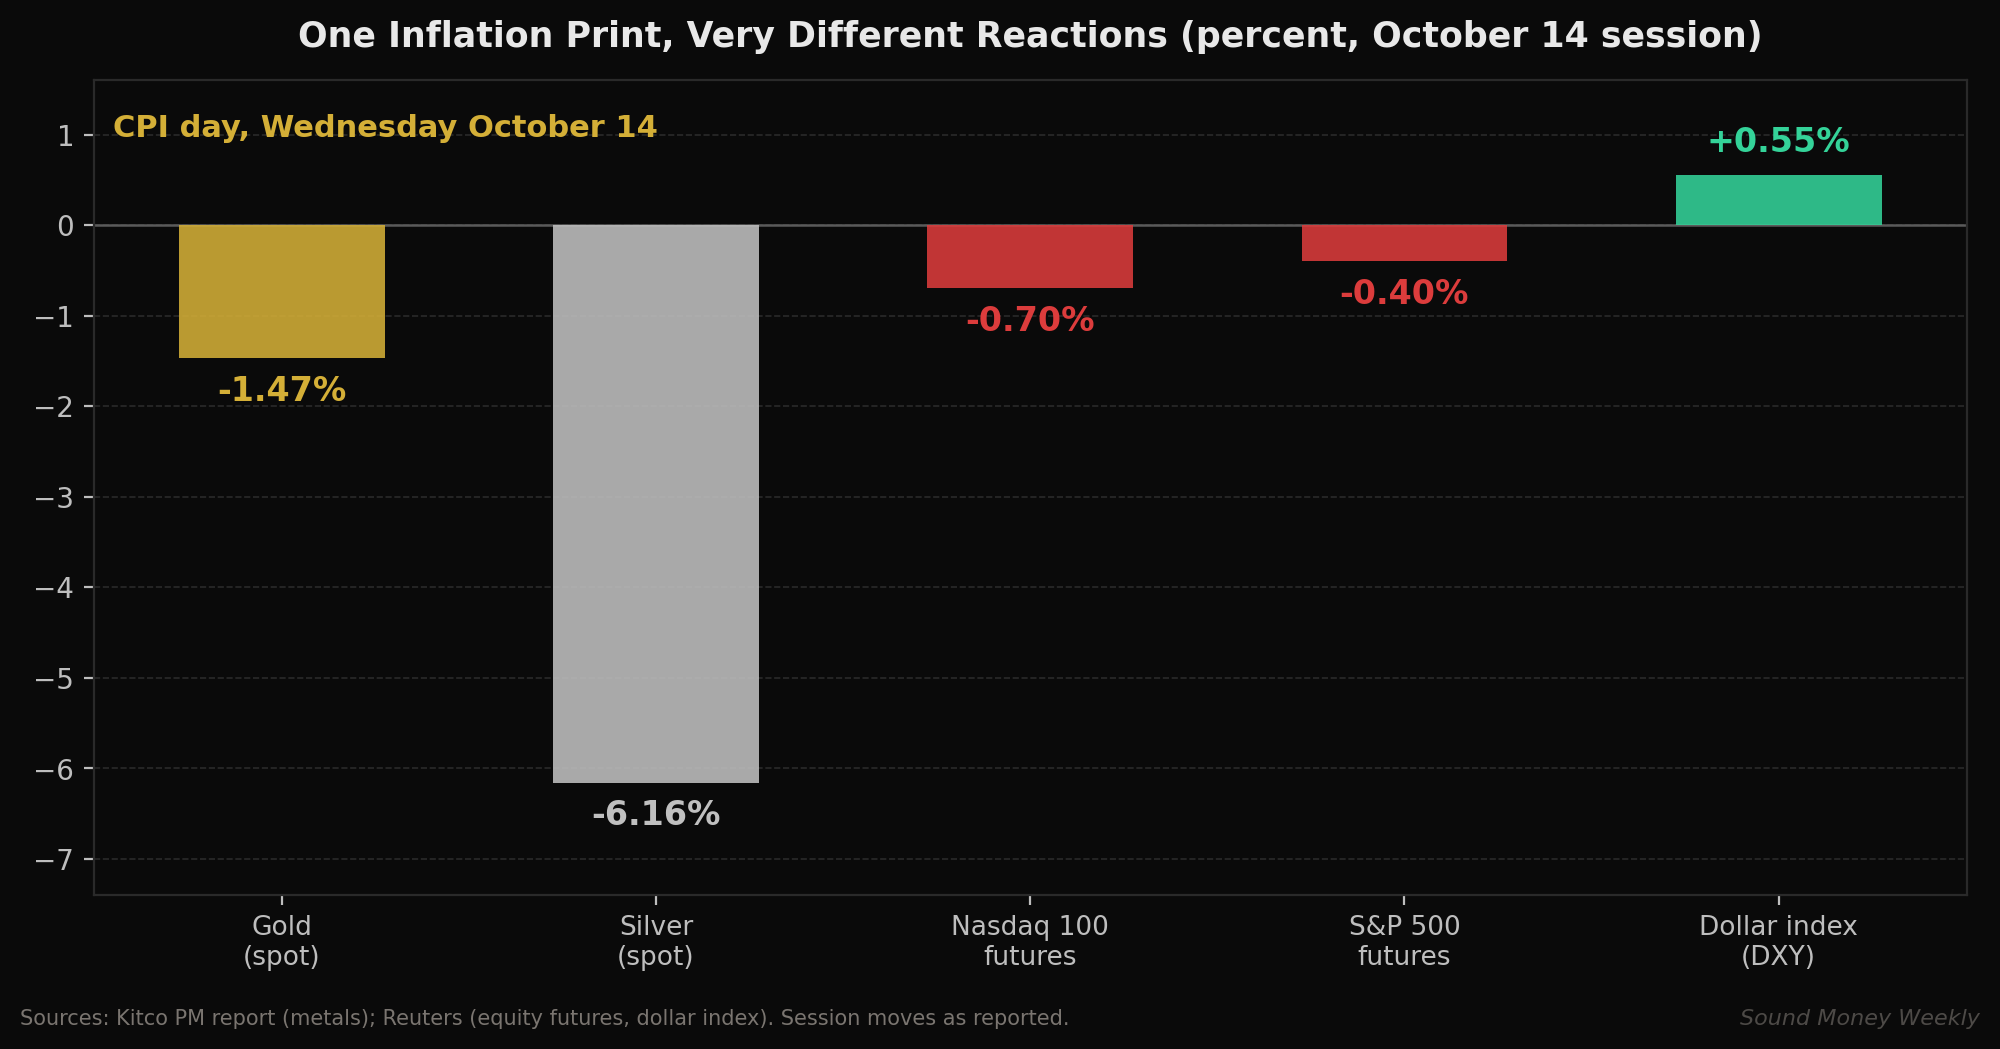
Silver fell more than four times as hard as gold. Why? The same report hit both metals through the rate channel, but silver carries a second exposure. Gold is purely a monetary asset in moments like this; silver is also an industrial one. Kitco's Wednesday note flagged that elevated energy and financing costs could constrain industrial activity — an additional risk for silver specifically. When a hot CPI print raises the odds of tighter policy and slower industrial activity at the same time, silver gets hit from both directions.
The haven twist on Thursday confirmed the split. When stocks sold off, gold traded like a safe haven — rallying alongside bonds. Silver, tied to the economic cycle, could not fully play that role.
The gold-silver ratio tells the same story
As of this morning's quoted prices, the gold-to-silver ratio stands at roughly 72.8 (computed from gold at $4,181.60 and silver at $57.46). Two months ago it sat in the mid-60s. A widening ratio means gold has been outperforming silver — exactly what you would expect when rate and recession fears dominate the tape. Historically, silver's biggest catch-up rallies have come after the fear phase peaks, not during it.
The October hike odds round trip
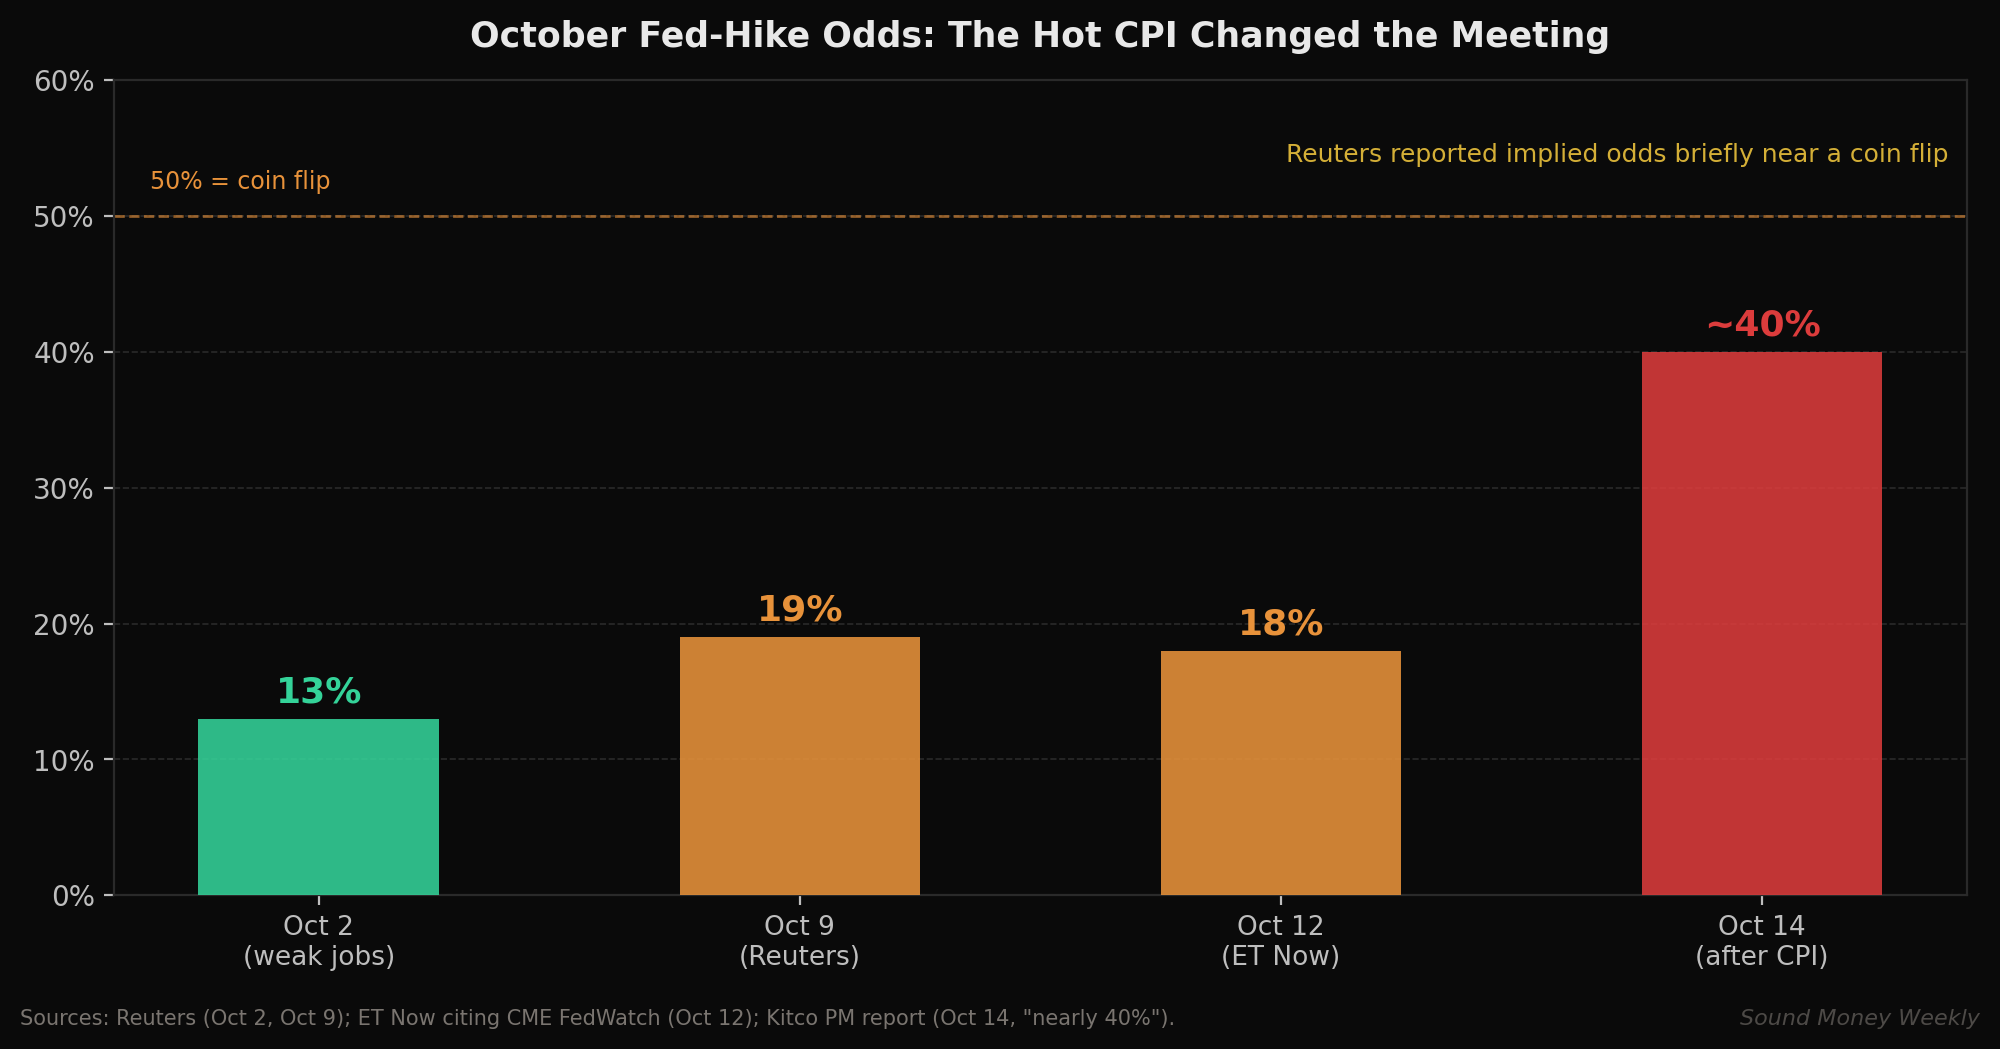
The CPI print revived a meeting the weak jobs report had deflated. From 13% after the October 2 jobs miss to roughly 40% after CPI, the October 27–28 meeting is live again — and December remains the market's expected landing spot for the next hike, with Reuters quoting strategists who said the Fed might even need 50 basis points in December.
India closed a door on paper gold — quietly
Late Thursday, several large Indian mutual funds — Kotak Mahindra, UTI, and HDFC — suspended bulk subscriptions to gold ETFs, following discussions with regulator SEBI, just ahead of the festive season when gold buying traditionally surges. Redemptions are unaffected, and exchange-listed ETF purchases remain available. A private-bank bullion dealer told Reuters the move looked "more like a precautionary measure to avoid a surge in imports," noting gold and silver imports had already fallen sharply over the prior two months.
Meanwhile, on the other side of Asia, Indonesia has been looking at the opposite problem — and it is one of the more surprising numbers in gold this month. The government estimates Indonesians hold roughly 1,800 tonnes of gold outside formal investment channels — much of it private, "under pillows" as a minister put it — and has discussed bringing as much as 20% of it into the bullion banking system. That is a reminder that Asia's gold story is not only about new mine supply or imports; there are enormous dormant stockpiles that formal markets could absorb.
What It Means
Let's translate the technical picture into plain English.
For gold: the week showed remarkable resilience. A hot CPI print, a 10-year yield at 5.3%, an 18-month-high dollar, and revived hike odds — and gold still finished within 0.6% of where it started, holding the $4,073–$4,217 range Kitco sketched. Analysts' levels cluster around $4,200 above and $4,000 below. The Fed's blackout period is now in effect, so the next major catalyst is the October 27–28 meeting itself.
For silver: the week was a reminder that silver is the more volatile metal, in both directions. A 6.16% single-day drop is painful if you are watching a screen — but it is also the same metal that surged roughly 8% in two sessions just three weeks ago. The structural deficit story (six consecutive annual supply shortfalls) has not changed; what changed was the macro weather.
For the DCA investor, the week did the quiet work:
- At Wednesday's close of $55.41, $200 bought 3.61 oz of silver. At this morning's $57.46, the same $200 buys 3.48 oz. The dip, in cold arithmetic, was a 3.7% discount on ounces.
- On gold: at the week's low of $4,073.35, $200 bought 0.0491 oz; at this morning's $4,181.60, it buys 0.0478 oz — a 2.6% difference in ounces for the same dollars.
- Stepping back: at today's gold price, $200/month buys about 34% more gold than it did at January's all-time high of $5,608. A year of $200 monthly contributions accumulates roughly 0.574 oz.
None of this requires a forecast. It is the arithmetic of consistency: price swings that look dramatic on a chart translate into modest, automatic discounts for anyone buying on a schedule.
What We're Watching
- The October 27–28 FOMC meeting. Odds of a hike are back near 40% after CPI. Whatever the Fed decides, the statement language and Warsh's press conference will matter more than the quarter-point itself.
- The 10-year yield. It closed the week near 5.2–5.3%. Sustained moves lower have preceded gold's best stretches; the AI-selloff haven bid is worth watching for durability.
- Oil and the Hormuz situation. Brent at $106 after the Dhahran incident keeps the inflation floor high — and with it, the case for a hawkish Fed.
- Silver's ratio recovery. At ~72.8, the GSR is stretched. Silver's catch-up rallies have historically started once fear stabilizes; watch for silver leading on days when yields fall.
- India post-Diwali. The ETF subscription caps and the festive season end in early November; import data afterward will show how much physical demand the restrictions actually deferred.
We will be back next Monday with the post-FOMC read.
Sound Money exists to make consistent precious metals accumulation accessible — you can learn more at sound.money.
Disclaimer: This content is provided by Sound Money for educational and informational purposes only. Nothing published here constitutes investment advice, financial advice, trading advice, or any other form of professional advice. Sound Money is not a registered investment advisor, broker-dealer, or financial planner. The information presented reflects our analysis of publicly available data and should not be relied upon as a basis for investment decisions. Precious metals investments carry risk, including the potential loss of principal. Past performance does not guarantee future results. Always consult a qualified financial advisor before making investment decisions. For more information about Sound Money's products and services, visit sound.money.
- gold
- silver
- precious-metals
- cpi
- inflation
- federal-reserve
- india