Everyone was watching gold. Silver quietly posted its best week in months. Then the ceasefire clock started ticking.
The Week Silver Took Over: +12%, Gold at $4,879, and 48 Hours to the Deadline
Sound Money Weekly | April 20, 2026
The Hook
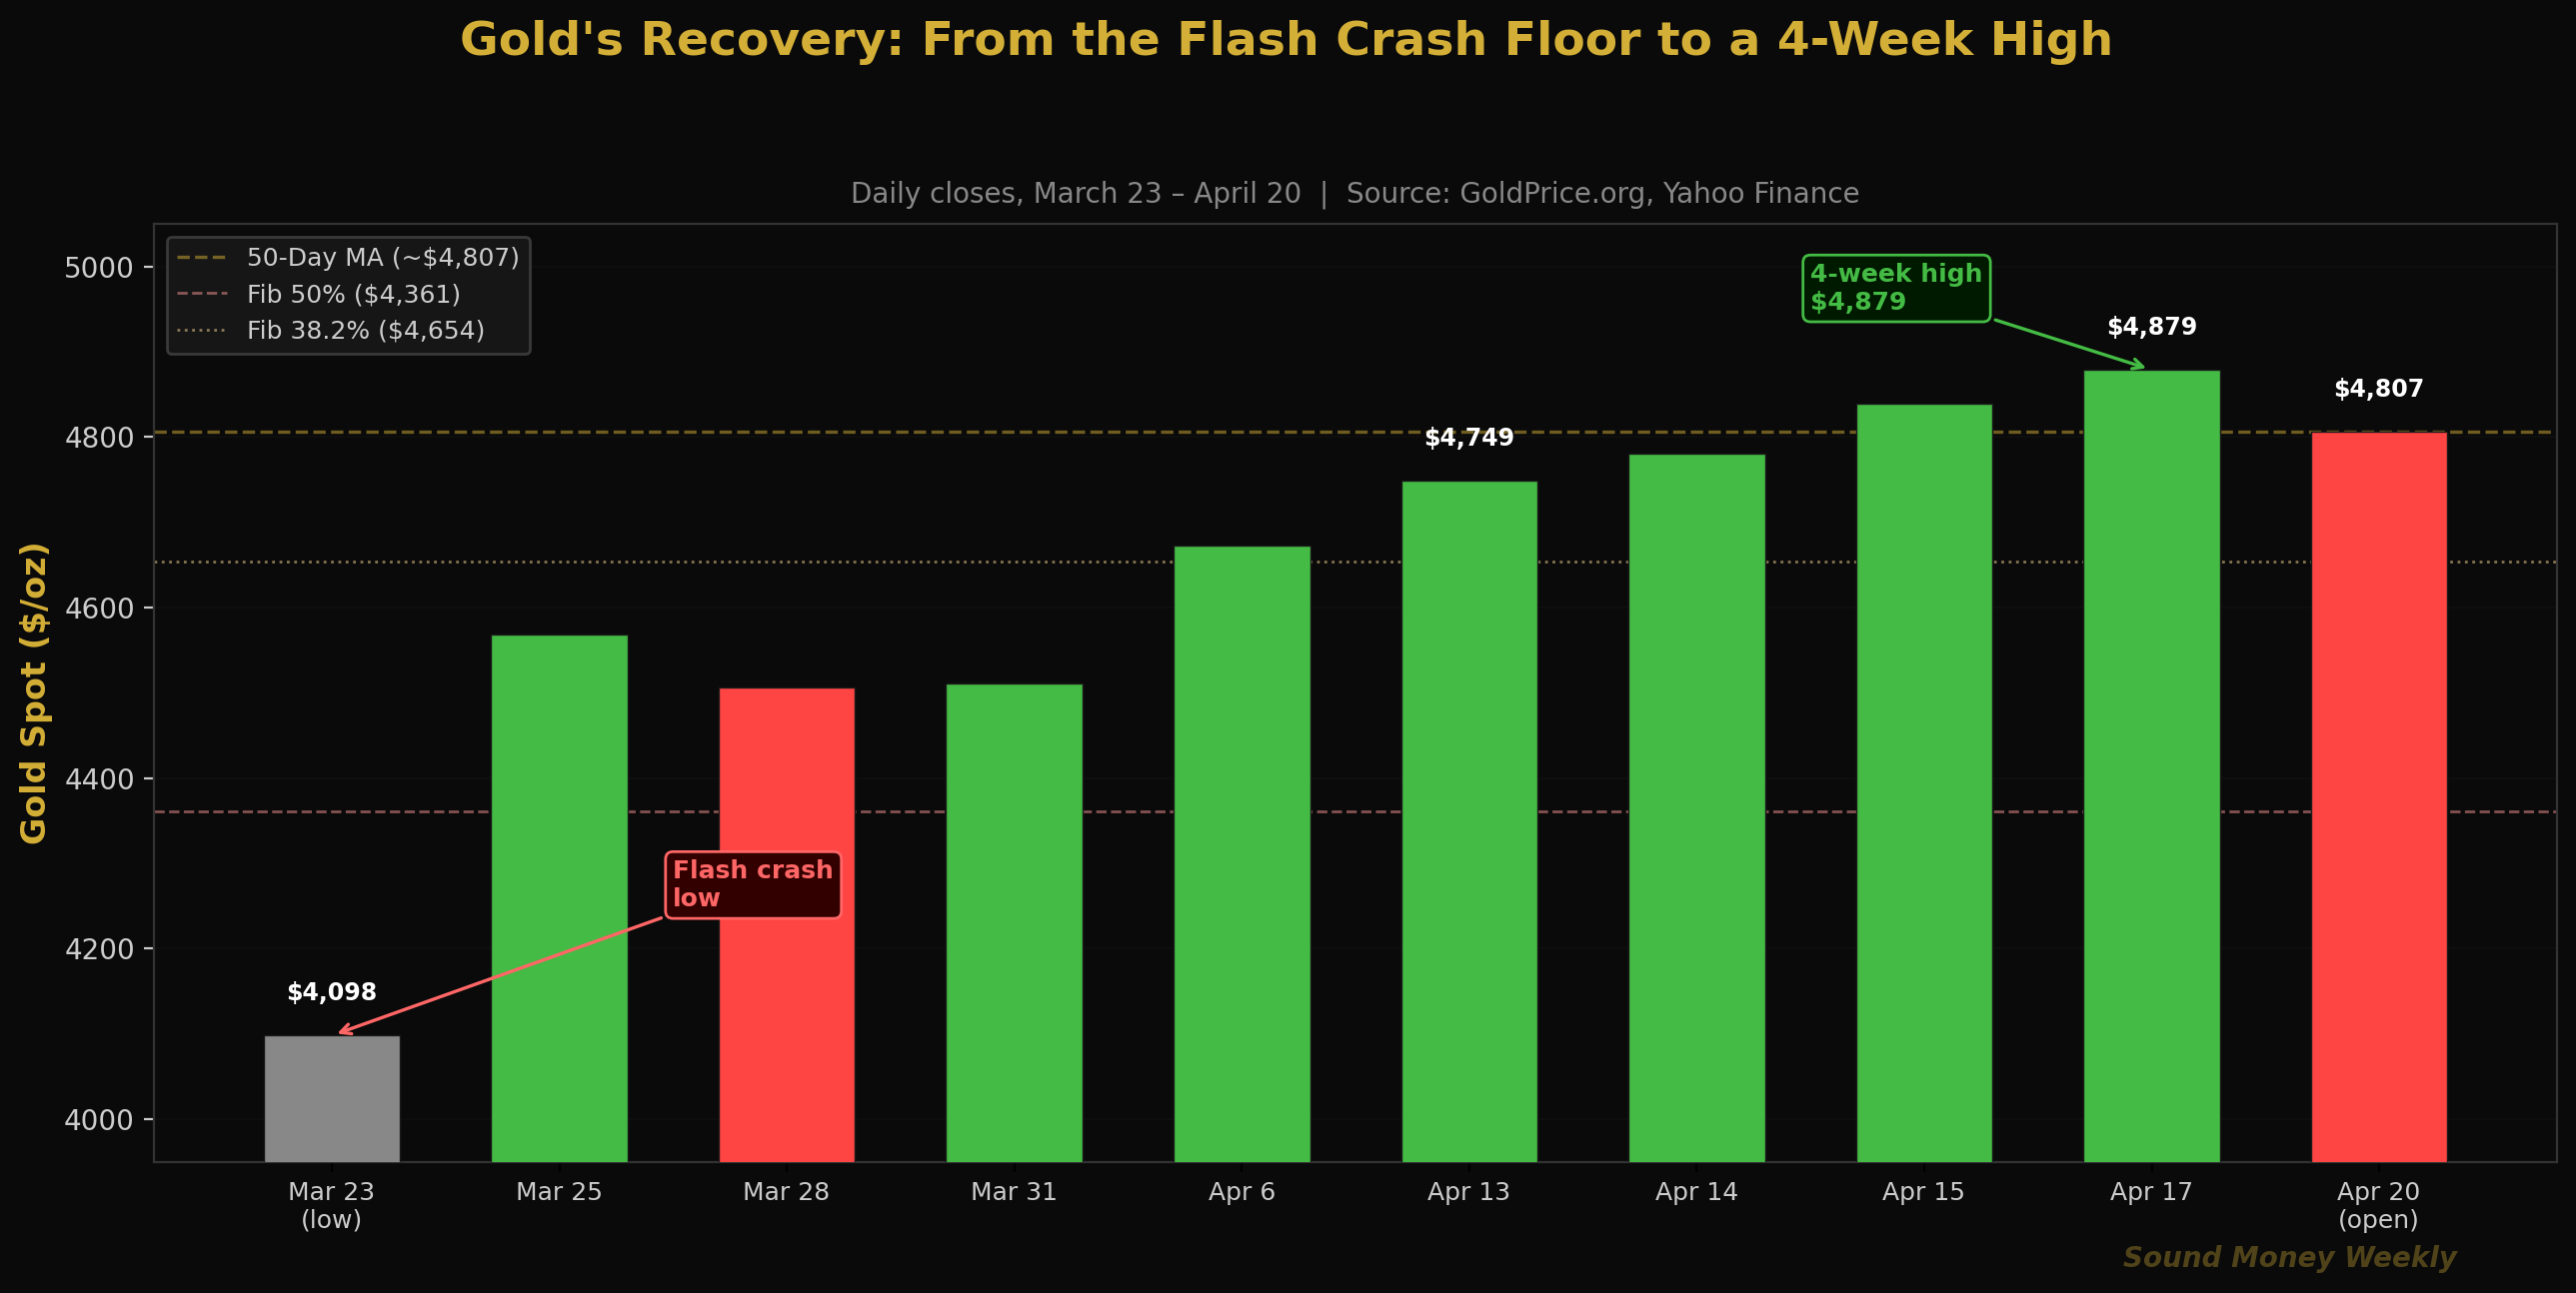
Gold hit a four-week high of $4,879 on Friday, April 17 -- the highest price since the day the historic March selloff began. Four consecutive weekly gains. A 19% recovery from the March 23 flash-crash low. Every major bank still targets $5,400 to $6,300 by year-end.
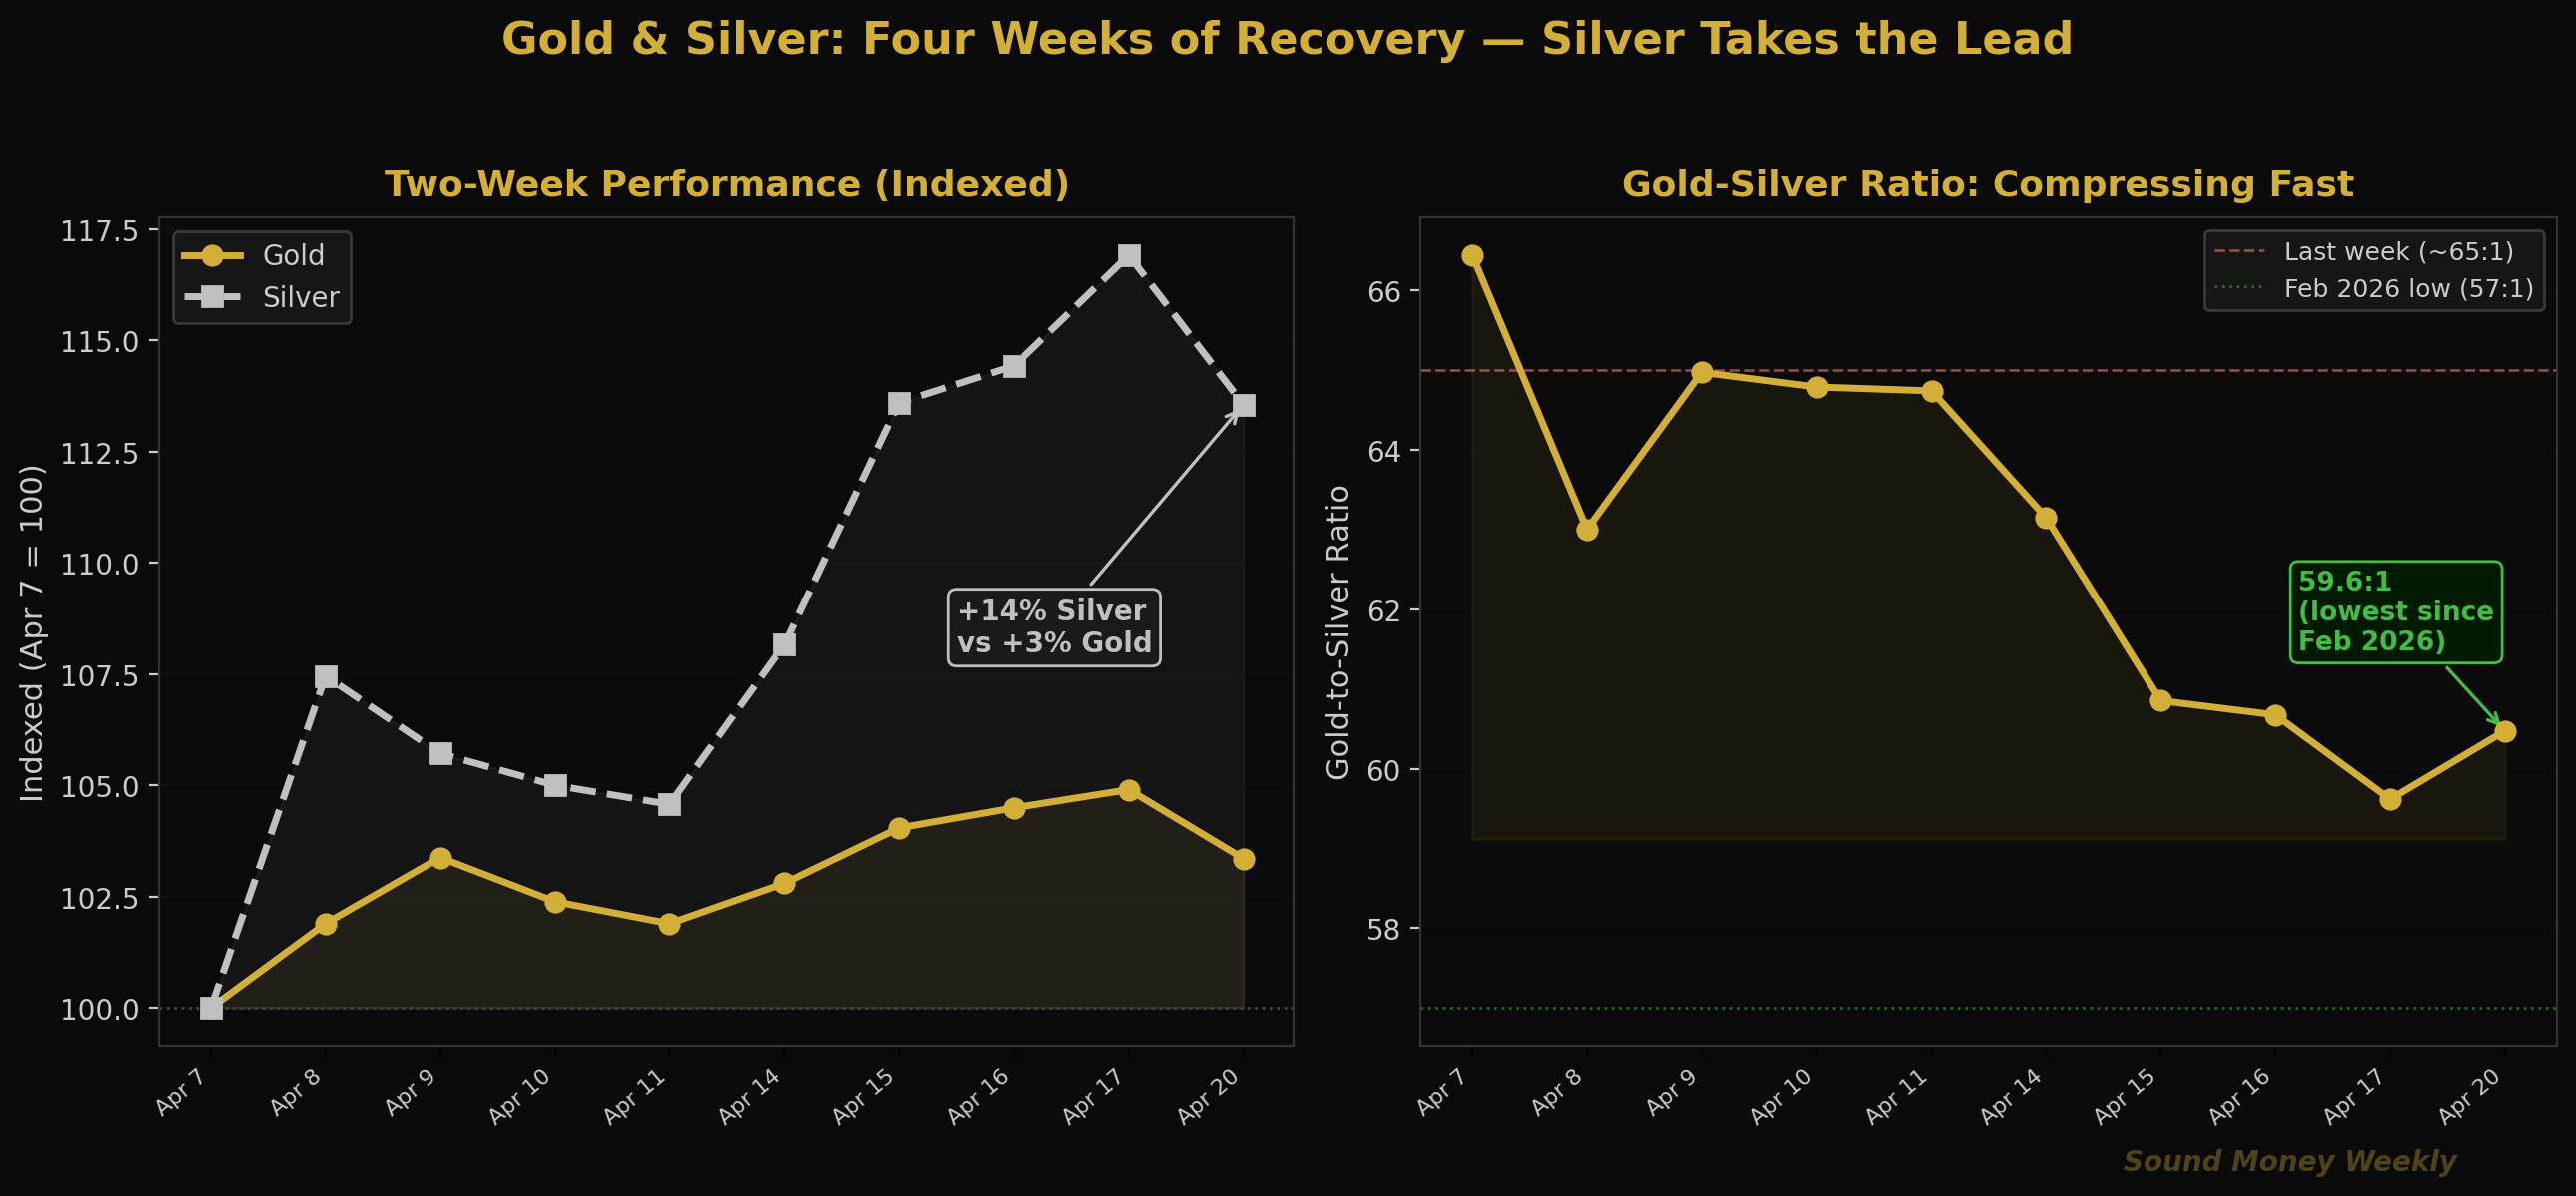
But the bigger story last week wasn't gold. It was silver.
Silver gained 12.1% in five sessions -- from $73.03 on April 11 to $81.84 on April 17. Gold gained 2.7% over the same period. Silver outperformed by nearly 10 percentage points. The gold-to-silver ratio compressed from 64:1 to 59.6:1 -- its lowest since February 2026 and the fastest single-week compression since the crisis began.
When silver starts outrunning gold this aggressively, the market is sending a signal. It has done this before, and the pattern has historically been bullish for both metals.
Now the immediate question: the two-week ceasefire that drove this recovery expires Wednesday, April 22. Iran is refusing to join a second round of Islamabad talks. US negotiators are in Pakistan today. The next 48 hours could be the most consequential for precious metals since the conflict began.
The Week in Full
Monday, April 14: Gold opened at $4,781 as markets digested the post-ceasefire momentum and the NFP data from Good Friday. Silver was at $78 -- already $5 higher than the previous Friday's close of $73 as buyers moved aggressively into the white metal. Gold closed at $4,757; silver at $75.71. Gold-silver ratio: 62.84:1.
Tuesday, April 15: The strongest session of the week. Gold rose 1.68% to $4,839. Silver surged 4.79% to $79.52. The GSR compressed to 60.85:1 -- the most notable single-day compression since the war began. For context, the GSR stood above 100:1 as recently as April 2025.
Wednesday-Thursday, April 16-17: Gold continued higher, reaching $4,879.60 by Friday's close -- a four-week high per Barchart data. Silver closed at $81.84. The GSR at $4,879/$81.84 = 59.6:1.
Friday/Weekend: The ceasefire narrative started fracturing. Iran fired on vessels in the Strait of Hormuz on Saturday. The US seized an Iranian-flagged cargo ship. Trump reinstated threats to bomb Iranian power plants and bridges. Iran's parliament speaker Ghalibaf said publicly they are "still far from a final discussion" and that Hormuz will stay restricted until the US lifts its naval blockade on Iranian ports.
Monday, April 20 (today): Gold futures opened at $4,764.90 -- down 2.4% from Friday's close -- as investors processed the weekend's escalation. Gold recovered early to ~$4,818 on news that a US delegation is in Islamabad. Silver opened at $79.49, relatively stable.
The Silver Story: What the Ratio Is Telling You
The gold-to-silver ratio is one of the most useful -- and most underappreciated -- indicators in precious metals. It measures how many ounces of silver it takes to buy one ounce of gold. The lower the ratio, the more relatively expensive silver is versus gold, which historically signals a risk-on, recovery-phase environment.
Here's the context:
| Period | GSR | What Was Happening |
|---|---|---|
| April 2025 (peak fear) | 105:1 | Silver at extreme discount to gold |
| January 2026 | ~57:1 | Bull market: silver catching up |
| March 23 (flash crash low) | ~67:1 | Silver sold off harder than gold |
| April 13 | 64:1 | Post-ceasefire recovery begins |
| April 17 | 59.6:1 | Silver outrunning gold |
| Historical average | 40-60:1 | We are now at the low end of normal |
Sources: Swiss America, GoldPrice.org, SilverPrice.org
At 59.6:1, we have entered what Swiss America identifies as the normal historical range of 40-60:1. During gold bull markets, the ratio has often compressed below 50:1 as silver catches up and overcorrects. The ratio was 105:1 just twelve months ago -- silver is still early in its compression relative to gold.
J.P. Morgan Global Research sees silver averaging $81/oz in 2026 -- which is essentially where silver closed Friday. Their projections were built on industrial demand fundamentals (solar, EVs, AI) and the supply deficit -- not on a ceasefire catalyst. The ceasefire is an additional tailwind on top of a structural story that was already compelling.
Under the Hood: The Technical View
For readers who want the levels and data. For the plain-English takeaway, skip to "What It Means."
Gold: Challenging the 50-Day Moving Average
After four consecutive weekly gains, gold has recovered to the point where the 50-day moving average (~$4,807) is now being tested as a level rather than resisted. Friday's $4,879 close cleared it momentarily. Today's open below $4,807 suggests the MA is providing some friction -- but the direction of travel is clear.
Key levels:
| Level | Price | Status |
|---|---|---|
| 50-Day MA | ~$4,807 | Being tested; reclaiming confirms trend recovery |
| Fib 0.236 (next resistance) | $4,954 | The next meaningful barrier |
| Fib 0.382 (support) | $4,654 | Solid support; held through the recovery |
| Fib 0.500 (major support) | $4,361 | The structural floor; never seriously tested since March |
| 200-Day MA | ~$4,200 | Long-term bull/bear line; well below current price |
Sources: FXLeaders April 20 analysis, Kitco/Barchart
The critical observation: gold has now reclaimed the 50-day MA, reclaimed the Fib 0.382 ($4,654), and put significant distance above the Fib 0.500 ($4,361). The correction phase is structurally over. The next key target is $4,954 (Fib 0.236) and then $5,000 as a psychological level.
Silver: Outrunning the Fundamentals
Silver's 12.1% weekly gain is not just a sentiment move. The structure of the silver market was already positioned for this. The Silver Institute projects a 67 million ounce supply deficit in 2026 -- the sixth consecutive annual shortfall. COMEX registered silver inventory stands at roughly 76 million ounces, down 75% from 2020 peaks. When physical supply is tight and investment demand returns, silver moves fast. That is what we are seeing.
At $81.84, silver is trading exactly at J.P. Morgan's 2026 average target -- meaning the rally has delivered on Q1 of the institutional thesis with the full year still ahead.
The Ceasefire Countdown: What Happens Wednesday
The two-week ceasefire agreed on April 8 expires at midnight Wednesday, April 22. As of this morning, the situation is genuinely uncertain:
Why talks are stalling: Trump imposed a naval blockade on Iranian ports on April 13 -- five days after the ceasefire was agreed. Iran considers this a ceasefire violation and has declared it will not reopen Hormuz until the blockade is lifted. Iran fired on commercial vessels in the Strait over the weekend, and the US seized an Iranian cargo ship. Both sides are accusing the other of violations.
Why talks could still happen: The US delegation (Witkoff, Kushner) arrived in Islamabad this morning. Pakistan has secured both the Serena Hotel and the Marriott for negotiations. Pakistan's PM Sharif spoke with Iran's President Pezeshkian by phone Sunday. Iranian parliament speaker Ghalibaf -- who is Tehran's chief negotiator -- has not completely walked away; he says "progress has been made" while also noting "we are still far from a final discussion."
The realistic outcome: Officials on all sides say a comprehensive permanent deal this week is off the table. The realistic goal is an extension of the ceasefire -- an MOU that could provide up to 60 days for broader negotiations. Al Jazeera's reporting confirms Pakistani officials are "cautiously optimistic" but acknowledge the "atmosphere cannot be assessed as very positive."
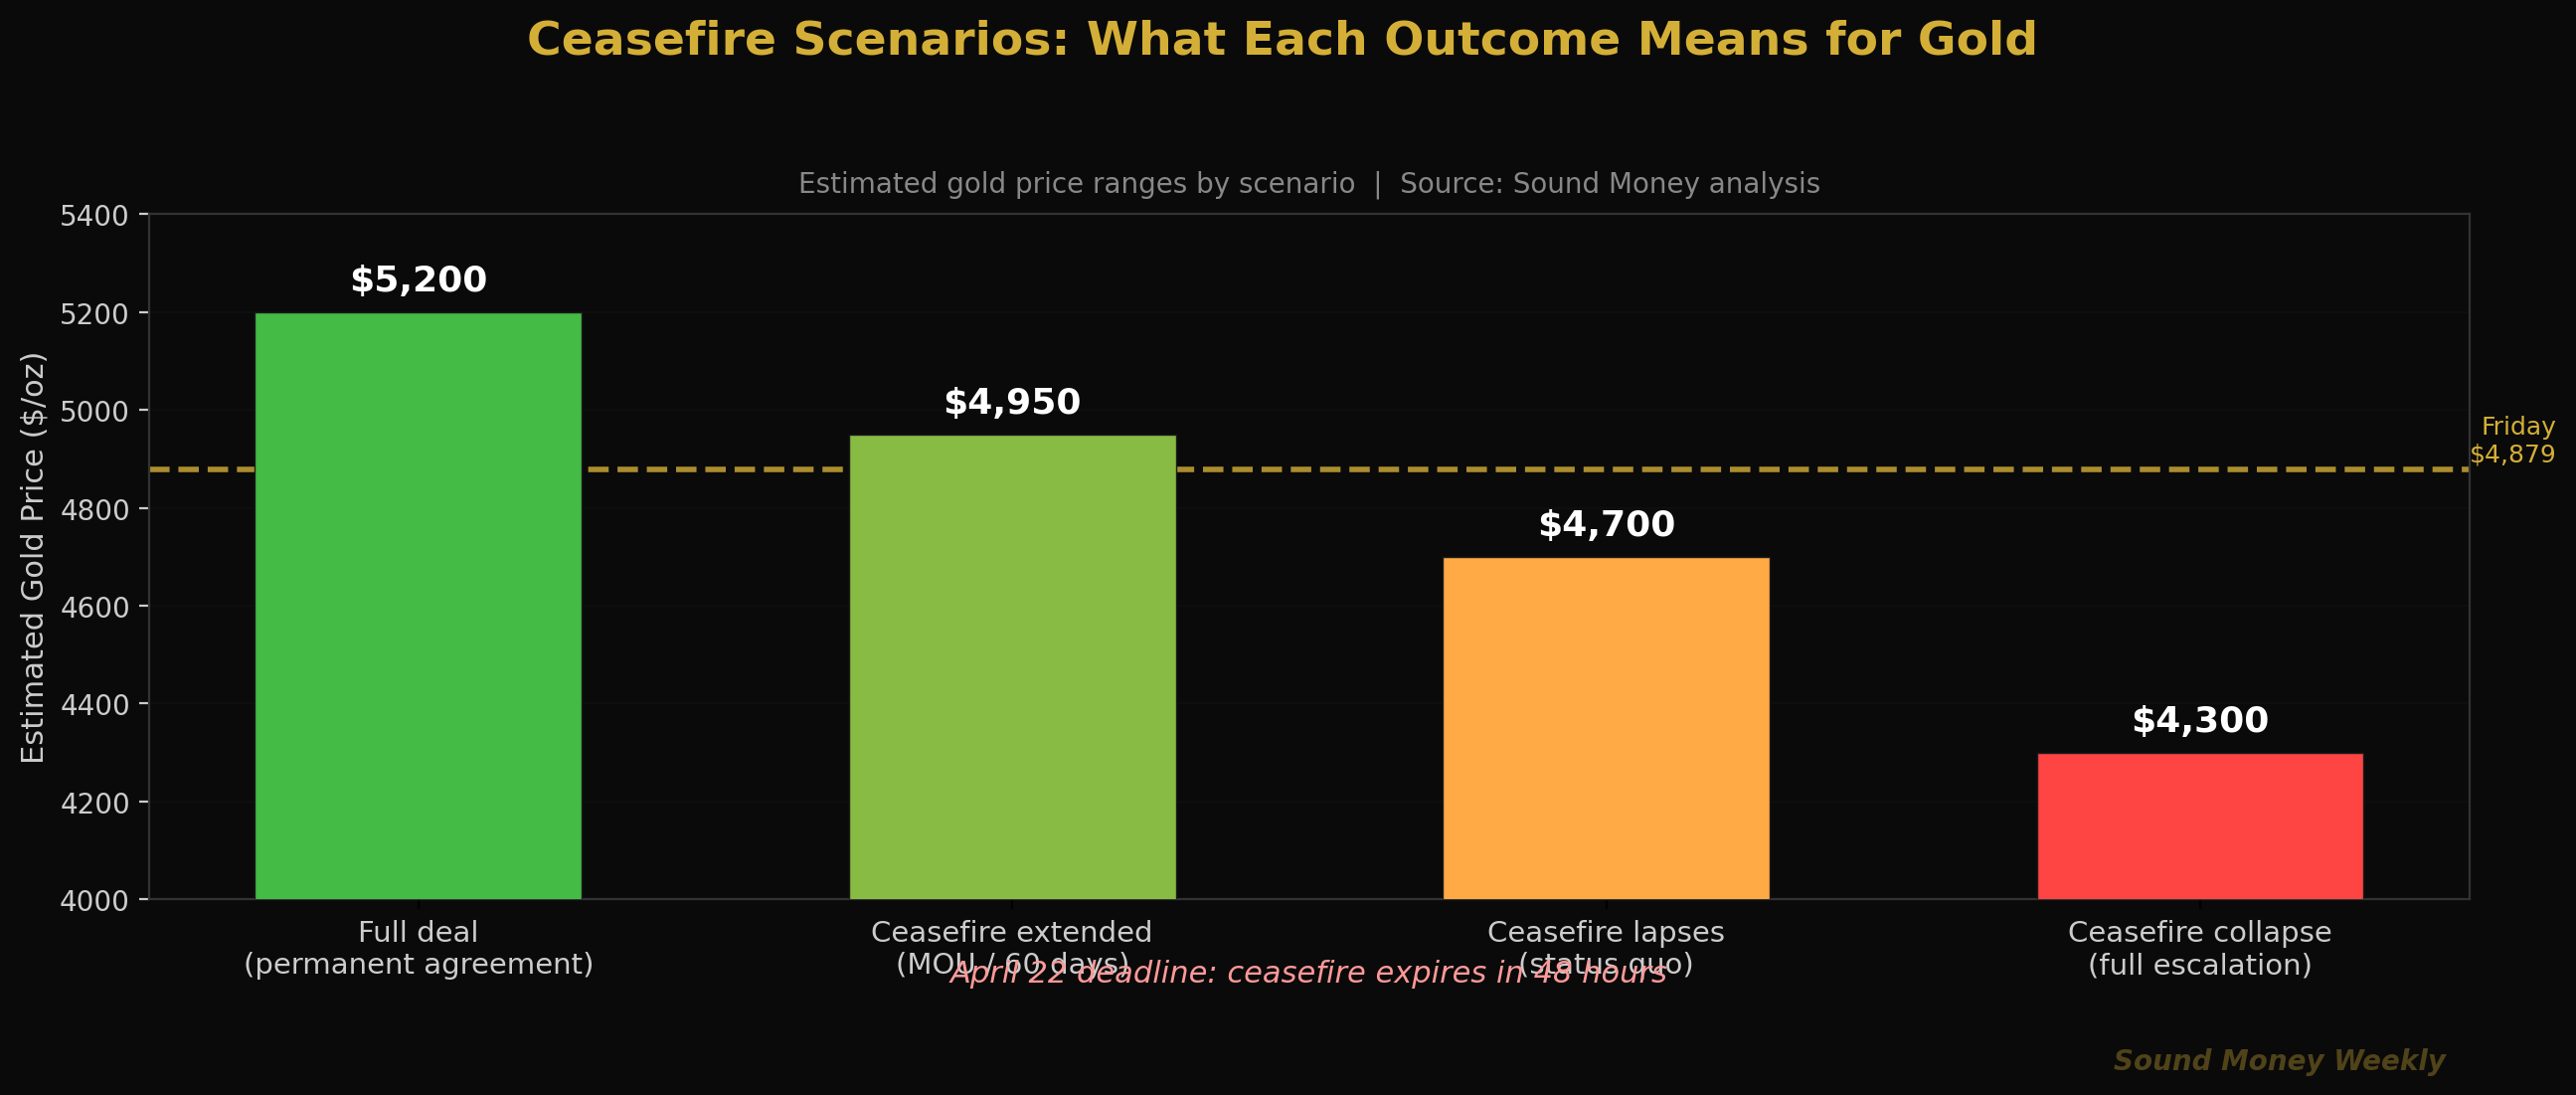
Here is how each scenario maps to gold:
| Scenario | Oil Impact | Gold Impact |
|---|---|---|
| Full deal (permanent) | Brent → $75-$80 | Gold → $5,100-$5,200 as rate cuts return |
| Ceasefire extended (MOU/60 days) | Brent → $88-$92 | Gold consolidates $4,800-$5,000 |
| Ceasefire lapses (status quo) | Brent stays $95-$110 | Gold range-bound $4,600-$4,800 |
| Full escalation | Brent → $130+ | Gold could test $4,300 (rate hike scenario) |
In three of four scenarios, gold stays at or above current levels. Only full escalation -- which would require both the US and Iran to abandon the Pakistani mediation entirely -- pushes gold materially lower.
The DCA Math: Silver Edition
We usually run this calculation for gold. This week, silver deserves its own numbers.
Silver's 12.1% weekly surge means one thing for consistent stackers: this was the kind of week that you want to already be accumulating through, not the week you decide to start.
| Entry Point | Silver Price | Oz per $200 | Value if silver reaches $100 |
|---|---|---|---|
| Jan 2026 high | $121.64 | 1.64 oz | $164 |
| March selloff | $61.05 (low) | 3.27 oz | $327 |
| April 13 | $73.03 | 2.74 oz | $274 |
| Today | $79.49 | 2.52 oz | $252 |
The person who has been stacking $200/month in silver throughout this cycle -- buying at $73 in April, at the selloff lows in March, through the volatility -- has accumulated at an average cost well below today's price. The person waiting for clarity before starting accumulates at today's prices or higher.
For gold: at $4,807 (today's open), a $200 purchase buys 0.04160 ounces -- 16.7% more metal than the same purchase at January's $5,608 all-time high. Over 12 months of consistent $200/month stacking at current levels, you accumulate approximately 0.499 ounces. At J.P. Morgan's $6,300 year-end target, that is worth $3,143 -- a 31% return on $2,400 invested.
The people who built wealth through gold's 1,075% total return since 2000 were not the ones who timed the entry perfectly. They were the ones who kept showing up every month. The winners in this game are always in the game.
What It Means
Here is the plain-English version.
Silver's 12% week is not noise. It reflects two things happening simultaneously: the market rewarding silver's dual role as both a monetary safe-haven (ceasefire bounce) and an industrial growth asset (solar, AI, EV demand). When both narratives align, silver moves fast and hard. The GSR compressing from 64:1 to 59.6:1 in one week is the mathematical expression of that.
Gold is technically healthy. Four consecutive weekly gains. The 50-day moving average reclaimed. The Fib 0.382 held as support through multiple tests. The flash-crash low at $4,098 is now a distant memory. The structural correction is over. The next question is not "will gold recover" but "how fast and by how much."
The ceasefire expiry is high-stakes but not the thesis. If the ceasefire lapses quietly without escalation, gold's range narrows but does not collapse. If it extends -- even for 60 days via an MOU -- gold has a clear path toward $5,000. The fundamental drivers that took gold from $3,300 to $5,608 in 2025 have not changed: central bank buying, fiscal deficits, dollar debasement, silver supply shortages. None of those resolve in April.
The GSR has room to run. At 59.6:1, we are at the bottom edge of the historical normal range. If J.P. Morgan's silver forecast ($81/oz average in 2026) is directionally correct, and gold reaches even the conservative end of the bank target range ($5,400 from Goldman), the GSR would fall to approximately 67:1 ($5,400/$81) -- meaning gold would actually have to outperform from here for the ratio to stay at current levels. If silver continues catching up, the ratio could compress toward 50:1 or lower.
This is not a recommendation. We do not know what happens in Islamabad this week. We do not know if the ceasefire holds. We do know that gold has delivered 10.9% annualized returns since 2000 with no negative rolling 20-year period. We know central banks have been net buyers for 17 consecutive years. We know silver has a structural supply deficit entering its sixth year. The data makes the case. We just report it.
What We're Watching
Wednesday, April 22: The ceasefire deadline. This is the single most important near-term variable. If Pakistan can get both delegations back to the table, a ceasefire extension is possible. If talks collapse and hostilities resume, oil spikes and gold faces short-term pressure. By Wednesday evening, we will know which way this breaks.
FOMC Meeting (April 28-29). The Fed meets next week. With March CPI at 3.3% (but core at 2.6%), the committee is unlikely to move in either direction. The key signal is the post-meeting statement: any softening on the "higher for longer" language would revive rate cut expectations and be materially bullish for gold.
April CPI (May 13). If Brent crude continues retreating from its $112 peak toward $90-$95, the April CPI print should show a dramatic decline in the energy component. A headline CPI below 2.5% would open the door to rate cut discussions and give gold a strong catalyst.
The $4,954 level. The next Fibonacci resistance for gold. A clean break above this level on sustained volume confirms that the recovery has transitioned from "bounce" to "resumption." Watch for it.
Silver's GSR trajectory. If the ratio breaks below 57:1 -- the February 2026 low -- silver is historically in a breakout zone where the move accelerates. We will be tracking it weekly.
Until Next Week
The most remarkable thing about last week is not the number -- it is the direction. Silver, which took the worst of the March selloff (nearly -50% from its January high to the flash-crash low), is now outrunning gold on the way back up. That is how precious metals bull markets have historically worked. Gold leads the move, silver follows, then silver overshoots.
We are watching that sequence play out in real time. The ceasefire gave silver its catalyst. The structural supply deficit and industrial demand gave it its floor. And the consistent stackers who loaded up through the panic of March are now watching their cost basis look increasingly attractive.
The deadline arrives Wednesday. The Fed meets next week. April CPI comes in May. Each of these events will move prices. None of them change the reason you own physical metal: the structural debasement of fiat currency, the relentless buying by central banks, and the mathematical reality that consistent accumulation across market cycles has been one of the most reliable long-term wealth preservation strategies in human history.
The winners in this game are always in the game. See you next Monday.
Sound Money offers fractional gold and silver ownership at whole-ounce pricing -- no minimums, no premiums. Learn more at sound.money.
Disclaimer: This content is provided by Sound Money for educational and informational purposes only. Nothing published here constitutes investment advice, financial advice, trading advice, or any other form of professional advice. Sound Money is not a registered investment advisor, broker-dealer, or financial planner. The information presented reflects our analysis of publicly available data and should not be relied upon as a basis for investment decisions. Precious metals investments carry risk, including the potential loss of principal. Past performance does not guarantee future results. Always consult a qualified financial advisor before making investment decisions. For more information about Sound Money's products and services, visit sound.money.
- gold
- silver
- precious-metals
- gold-silver-ratio
- iran
- ceasefire
- dca
- weekly-update