Gold's worst month since the financial crisis is in the books. The recovery has already begun -- and the next 72 hours could determine the trajectory for the rest of the year.
Q2 Begins at a Crossroads: Gold Recovers 3.5% as Ceasefire Talks Intensify
Sound Money Weekly | April 6, 2026
The Hook
March 2026 will go into the record books as gold's worst month since October 2008 -- a 13% decline that wiped $650 off the per-ounce price in 31 days. But something shifted in the final week. Gold rallied approximately 3.5% from its March 28 close of $4,506 to end the first week of April at $4,673 -- its first positive week in a month.
Three catalysts converged to flip the momentum:
Powell killed the rate hike narrative. Fed Chair Jerome Powell's March 30 remarks at Harvard confirmed long-term inflation expectations remain "anchored." Markets shifted from pricing near-certain rate hikes to briefly assigning 20% odds of a cut by year-end. The two-year Treasury yield dropped 10 basis points intraday. Gold jumped $135 on April 1 -- its biggest single-day gain since March 25.
NFP beat expectations but with an asterisk. March nonfarm payrolls came in at +178,000 versus +57,000 expected -- but 76,000 of those jobs came from healthcare, driven by a one-time Kaiser Permanente strike resolution. Strip that out and the organic print was roughly +102,000 -- above the dire consensus but not a signal of labor market reacceleration. Markets were closed for Good Friday; the real reaction comes today.
Pakistan is brokering a ceasefire. As of Sunday night, Pakistan's army chief Field Marshal Asim Munir was in overnight talks with VP Vance, envoy Witkoff, and Iran's foreign minister. The framework -- tentatively called the "Islamabad Accord" -- proposes an immediate ceasefire, reopening of the Strait of Hormuz, and a 15-20 day window to finalize a broader settlement. Iran remains non-committal on Hormuz, but this is the closest the two sides have come to a deal since the war began.
Gold enters Q2 at $4,673 -- still 17% below January's $5,608 all-time high, but firmly off the $4,098 flash-crash low. For anyone dollar cost averaging, the question isn't whether to stack -- it's how much metal these prices are putting into your account compared to two months ago.
The Week in Full
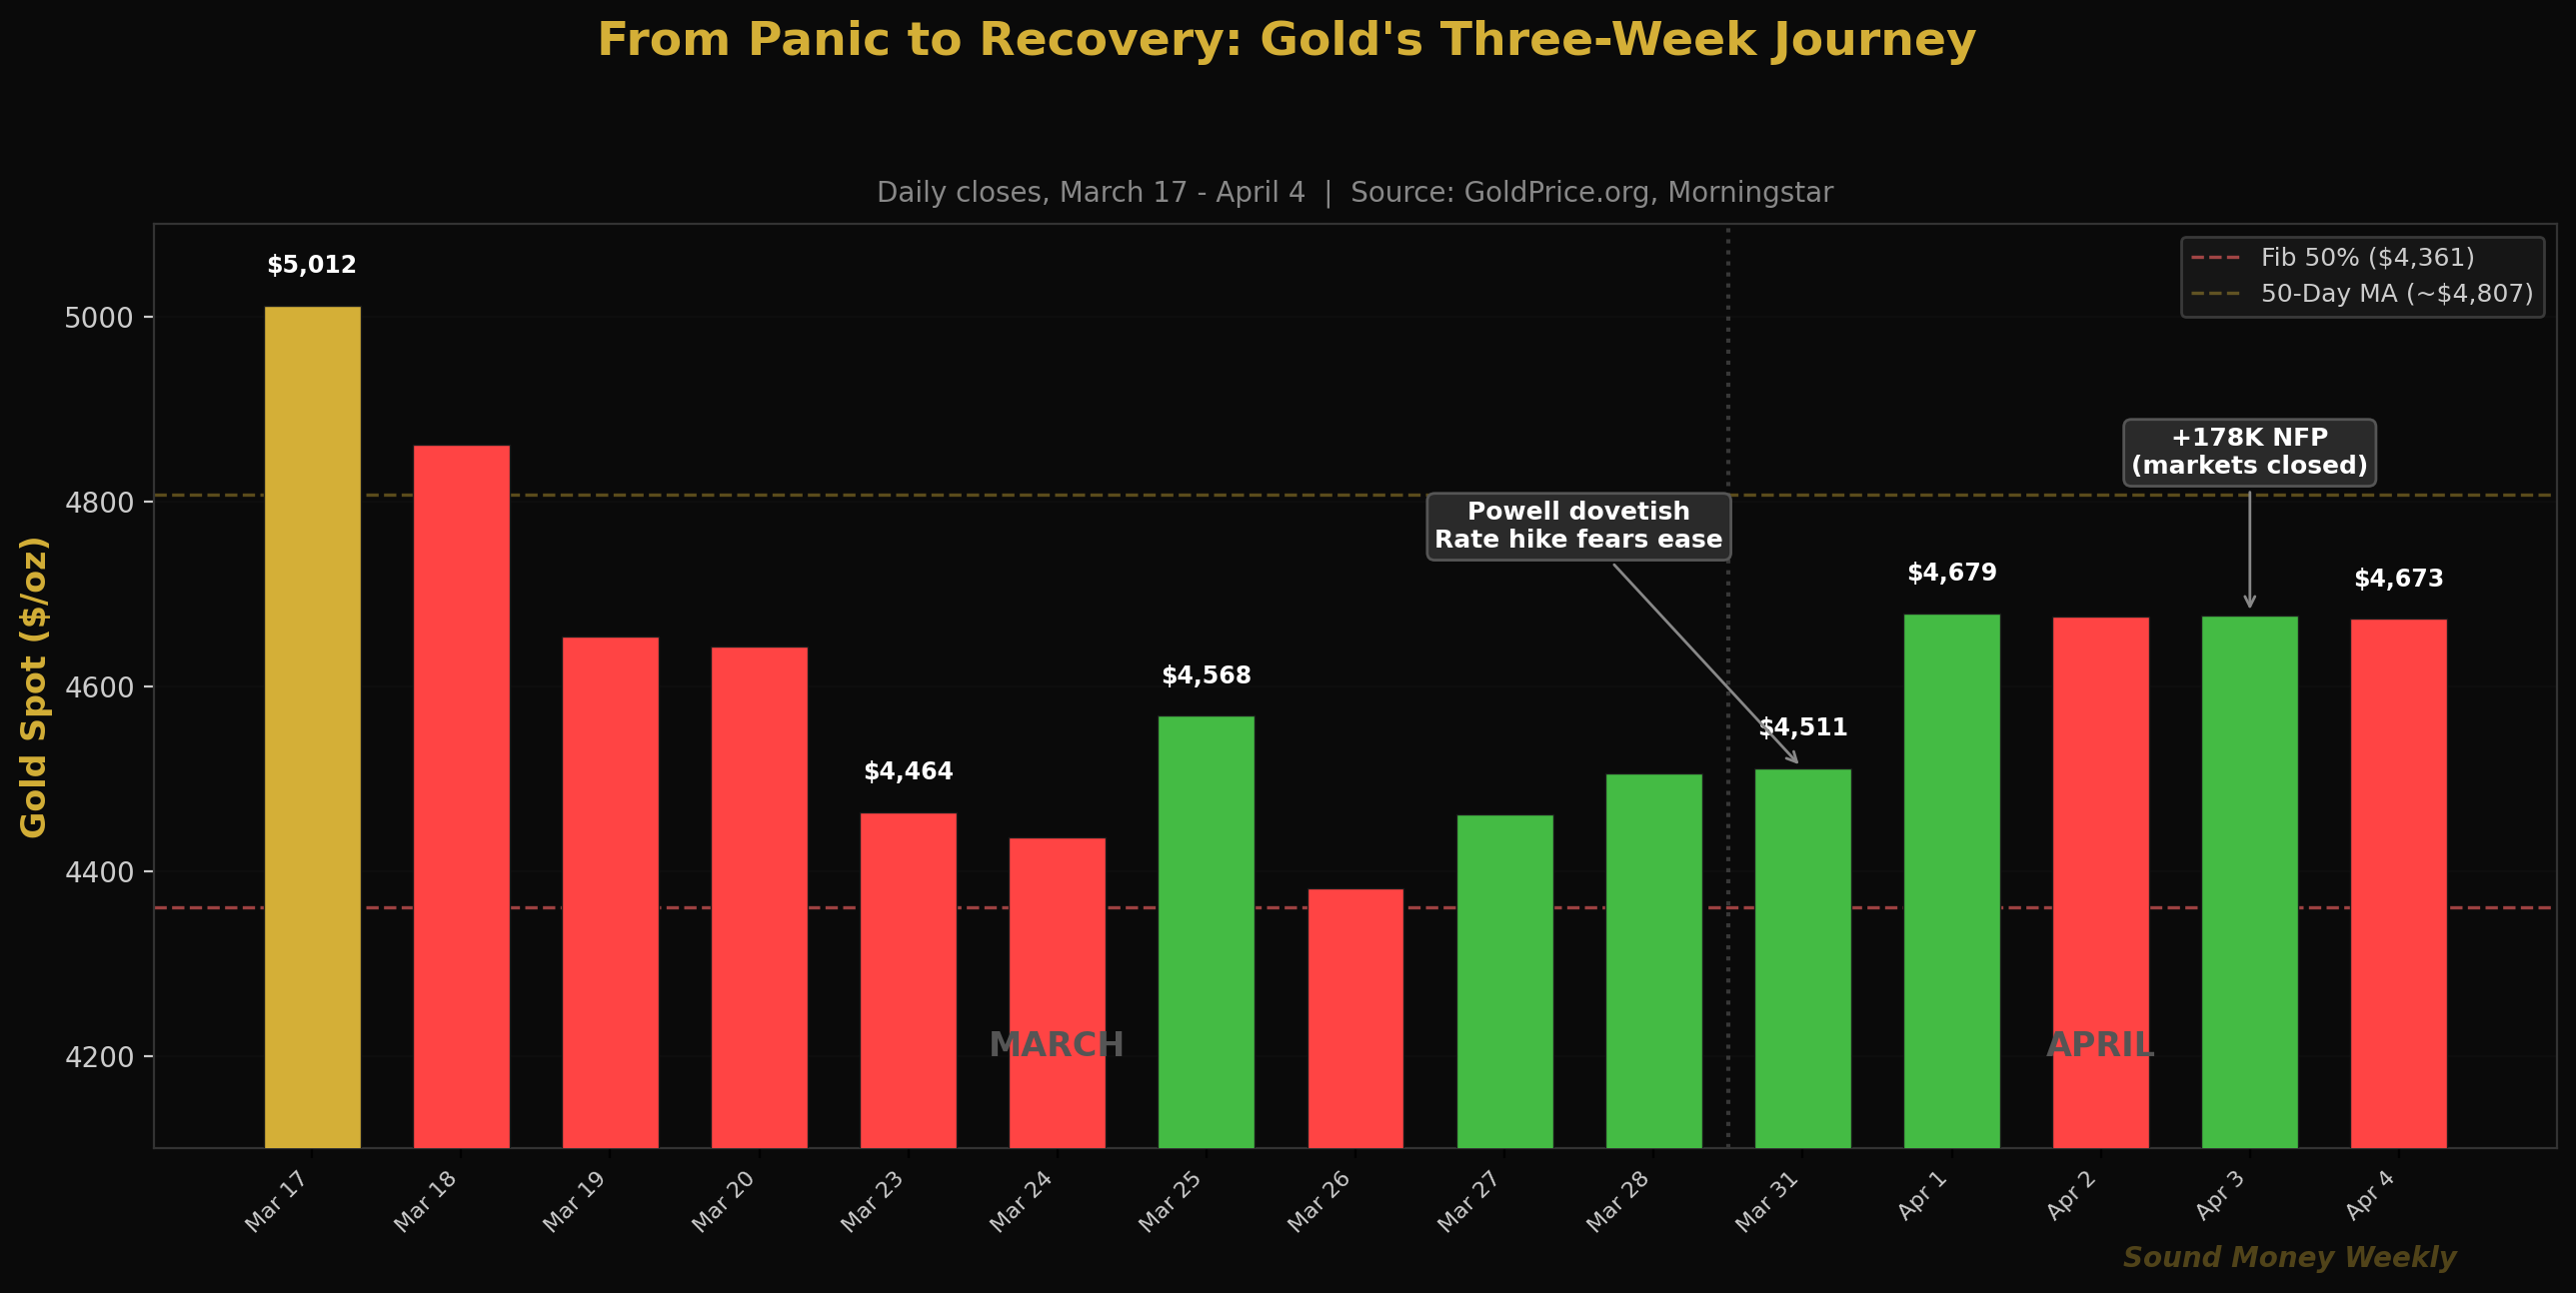
Monday, March 31: Gold rose 1.4% to $4,511 as Powell's Harvard comments rippled through markets. Silver jumped 4.3% to $73.04 -- the first >3% single-session move in silver since the flash crash. The gold-to-silver ratio compressed to 61.8:1 from 64.4:1, signaling silver was attracting risk-on positioning.
Tuesday, April 1: The biggest day of the week. COMEX gold settled at $4,783.20 -- up 2.92%, the largest single-day gain since March 25. Dip-buyers entered aggressively as rate hike fears faded. Bloomberg reported that institutional dip-buying had resumed after nearly three weeks of outflows.
Wednesday-Thursday, April 2-3: Gold consolidated around $4,675, holding its gains. Fortune reported spot gold at $4,675 on Wednesday, with silver at $71.39. Markets digested the ADP data and awaited NFP.
Friday, April 4 (Good Friday): NFP dropped at 8:30 AM but equity and commodity markets were closed. Gold's last trade was $4,673. The +178K print -- more than triple expectations -- will be digested today, Monday April 6. Verified Investing's analysis notes "gap risk" given the delayed reaction.
Net result: Gold gained approximately 3.5% for the week. Silver rose from $69.98 to $73.03 (+4.4%). The gold-to-silver ratio compressed from 64.4:1 to 64.0:1. After three consecutive weeks of losses, both metals posted their first weekly gain since mid-March.
March in the Record Books
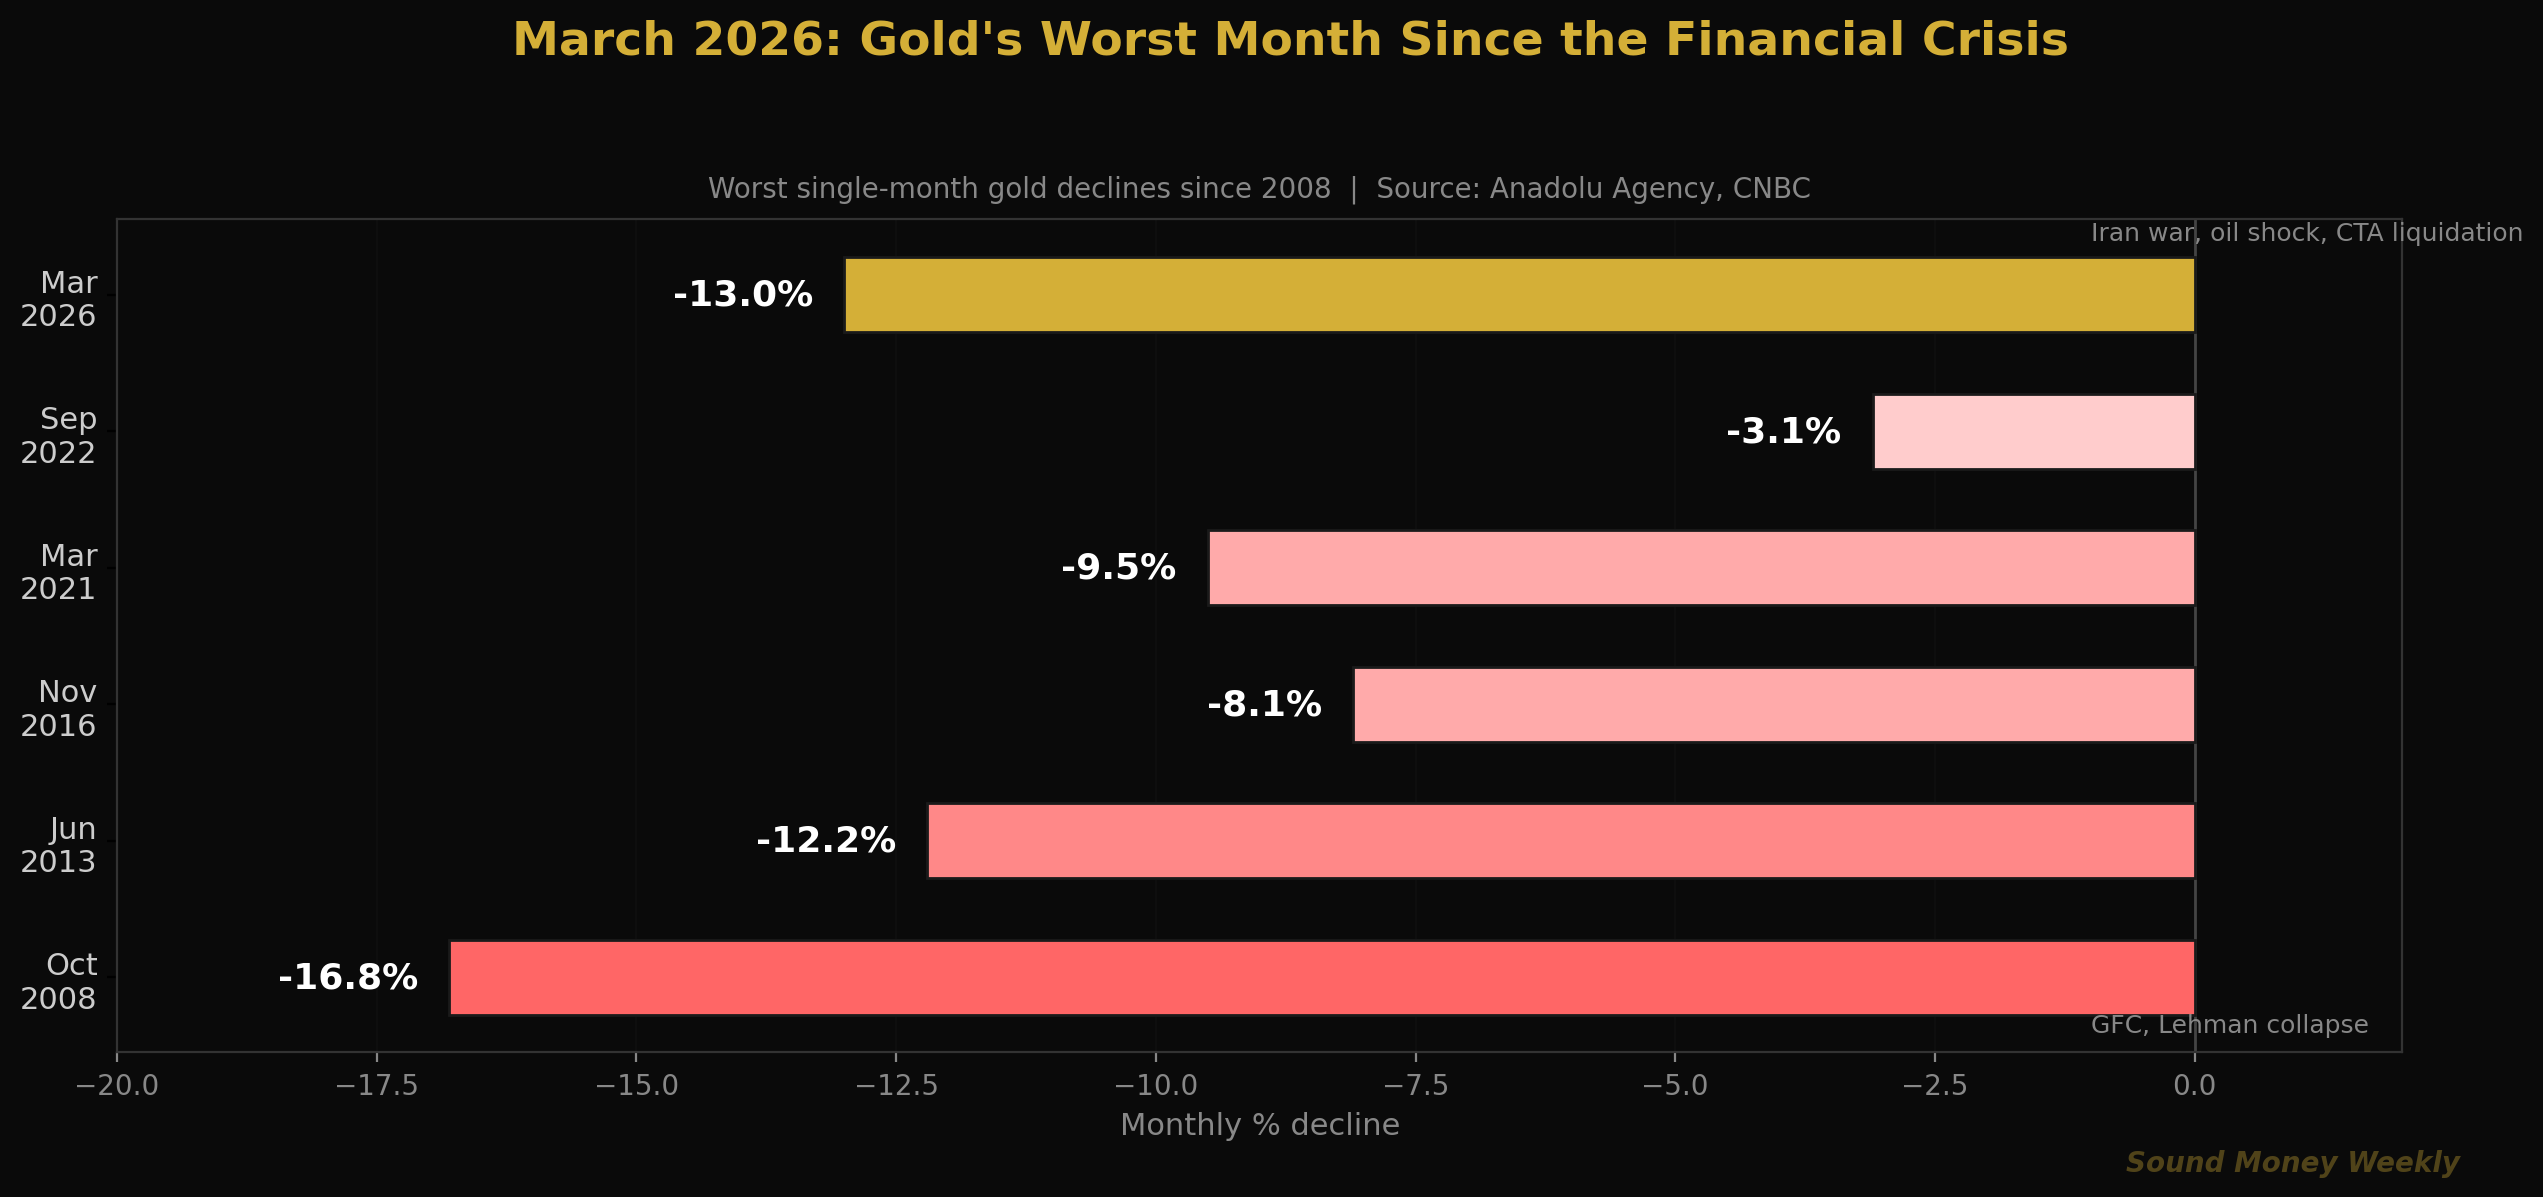
March's -13% decline (-11.3% per Anadolu Agency, -13%+ when measured close-to-close per Equiti) makes it gold's worst month since October 2008, when Lehman Brothers collapsed and gold fell 16.8%. For context, it's worse than any month during the 2013 taper tantrum, worse than the COVID crash, and worse than the 2022 rate hike cycle.
But here's the detail the headlines miss: despite March's carnage, gold is still up approximately 5% for Q1 2026 as a whole, according to Equiti's analysis. The January-February rally built enough cushion that even a historically bad month couldn't wipe out the quarterly gain. That's the kind of resilience that matters for long-term holders.
Under the Hood: The Technical View
For readers who want the levels, ratios, and data. For the plain-English takeaway, skip to "What It Means."
Gold's Technical Picture
Gold closed the week at $4,673, which puts it:
- 17% below the January $5,608 all-time high
- 14% above the March 23 flash-crash low of $4,098
- Sitting between the Fibonacci 50% retracement at $4,361 (support) and the 50-day moving average near $4,807 (resistance)
| Level | Price | Significance |
|---|---|---|
| 50-Day MA (resistance) | ~$4,807 | The key overhead barrier; reclaiming this = trend recovery confirmed |
| Fib 0.382 (resistance) | $4,654 | Reclaimed this week -- bullish |
| Current price | $4,673 | Just above the broken 0.382 level |
| Fib 0.500 (support) | $4,361 | The fulcrum; held through all of March |
| 200-Day MA (support) | ~$4,200 | Bull/bear dividing line |
The bullish development this week: gold reclaimed the $4,654 Fibonacci 0.382 level, which had served as support before the selloff and then as resistance during the March consolidation. Reclaiming it suggests the market views the $4,400-$4,500 range as a legitimate floor, not just a pause before further selling.
The next test is the 50-day moving average near $4,807. FXLeaders' March 30 analysis projected a potential move to $4,700-$5,000 if Powell and NFP were supportive -- and so far, both have been.
Silver: Outperforming on the Bounce
Silver rose 4.4% for the week versus gold's 3.5%, consistent with silver's pattern of outperforming gold during recovery phases. The gold-to-silver ratio compressed from 64.4:1 to 64.0:1. FXLeaders projects silver resistance at $73-$75 this week, with a break above potentially targeting $78.
COMEX registered silver inventory continues to decline -- now at 76.55 million ounces, down 75% from 2020 peaks. The Silver Institute's projection of a 67 million ounce deficit in 2026 remains intact.
The NFP Puzzle
The headline +178,000 print looks strong, but the composition tells a different story. Per BLS data and Verified Investing's analysis:
| Detail | Number |
|---|---|
| Total NFP | +178,000 |
| Consensus | +57,000 |
| Healthcare alone | +76,000 (42.7% of total) |
| Of which: strike reversal | ~+35,000 (Kaiser Permanente) |
| Organic print (ex-strike) | ~+102,000 |
| Unemployment rate | 4.3% (unchanged) |
| Avg hourly earnings | +0.2% m/m, +3.5% y/y (cooling) |
| Federal government | Continued decline |
The report is hot on the surface, cooling underneath. Wage growth at 3.5% is the lowest in two years. Federal government employment continues to contract. The healthcare surge won't repeat -- it was a one-time strike resolution. For gold, the read is ambiguous: strong enough to keep the Fed on hold, but weak enough in composition to keep rate cuts in play for later in the year.
The Iran Variable
As of Sunday night April 5, the closest thing to a ceasefire framework has emerged. Per Reuters via NDTV, Pakistan has proposed a two-phase deal:
- Phase 1: Immediate ceasefire, reopening of the Strait of Hormuz, structured as an MOU finalized electronically through Pakistan.
- Phase 2: Broader settlement negotiated in person in Islamabad over 15-20 days. Tentatively called the "Islamabad Accord."
The deal is not done. Iran has rejected the US 15-point proposal and remains non-committal on reopening Hormuz without guarantees. Trump has set a 48-hour deadline for Hormuz reopening before escalating strikes on Iranian infrastructure. Pakistan, Turkey, and Egypt are mediating.
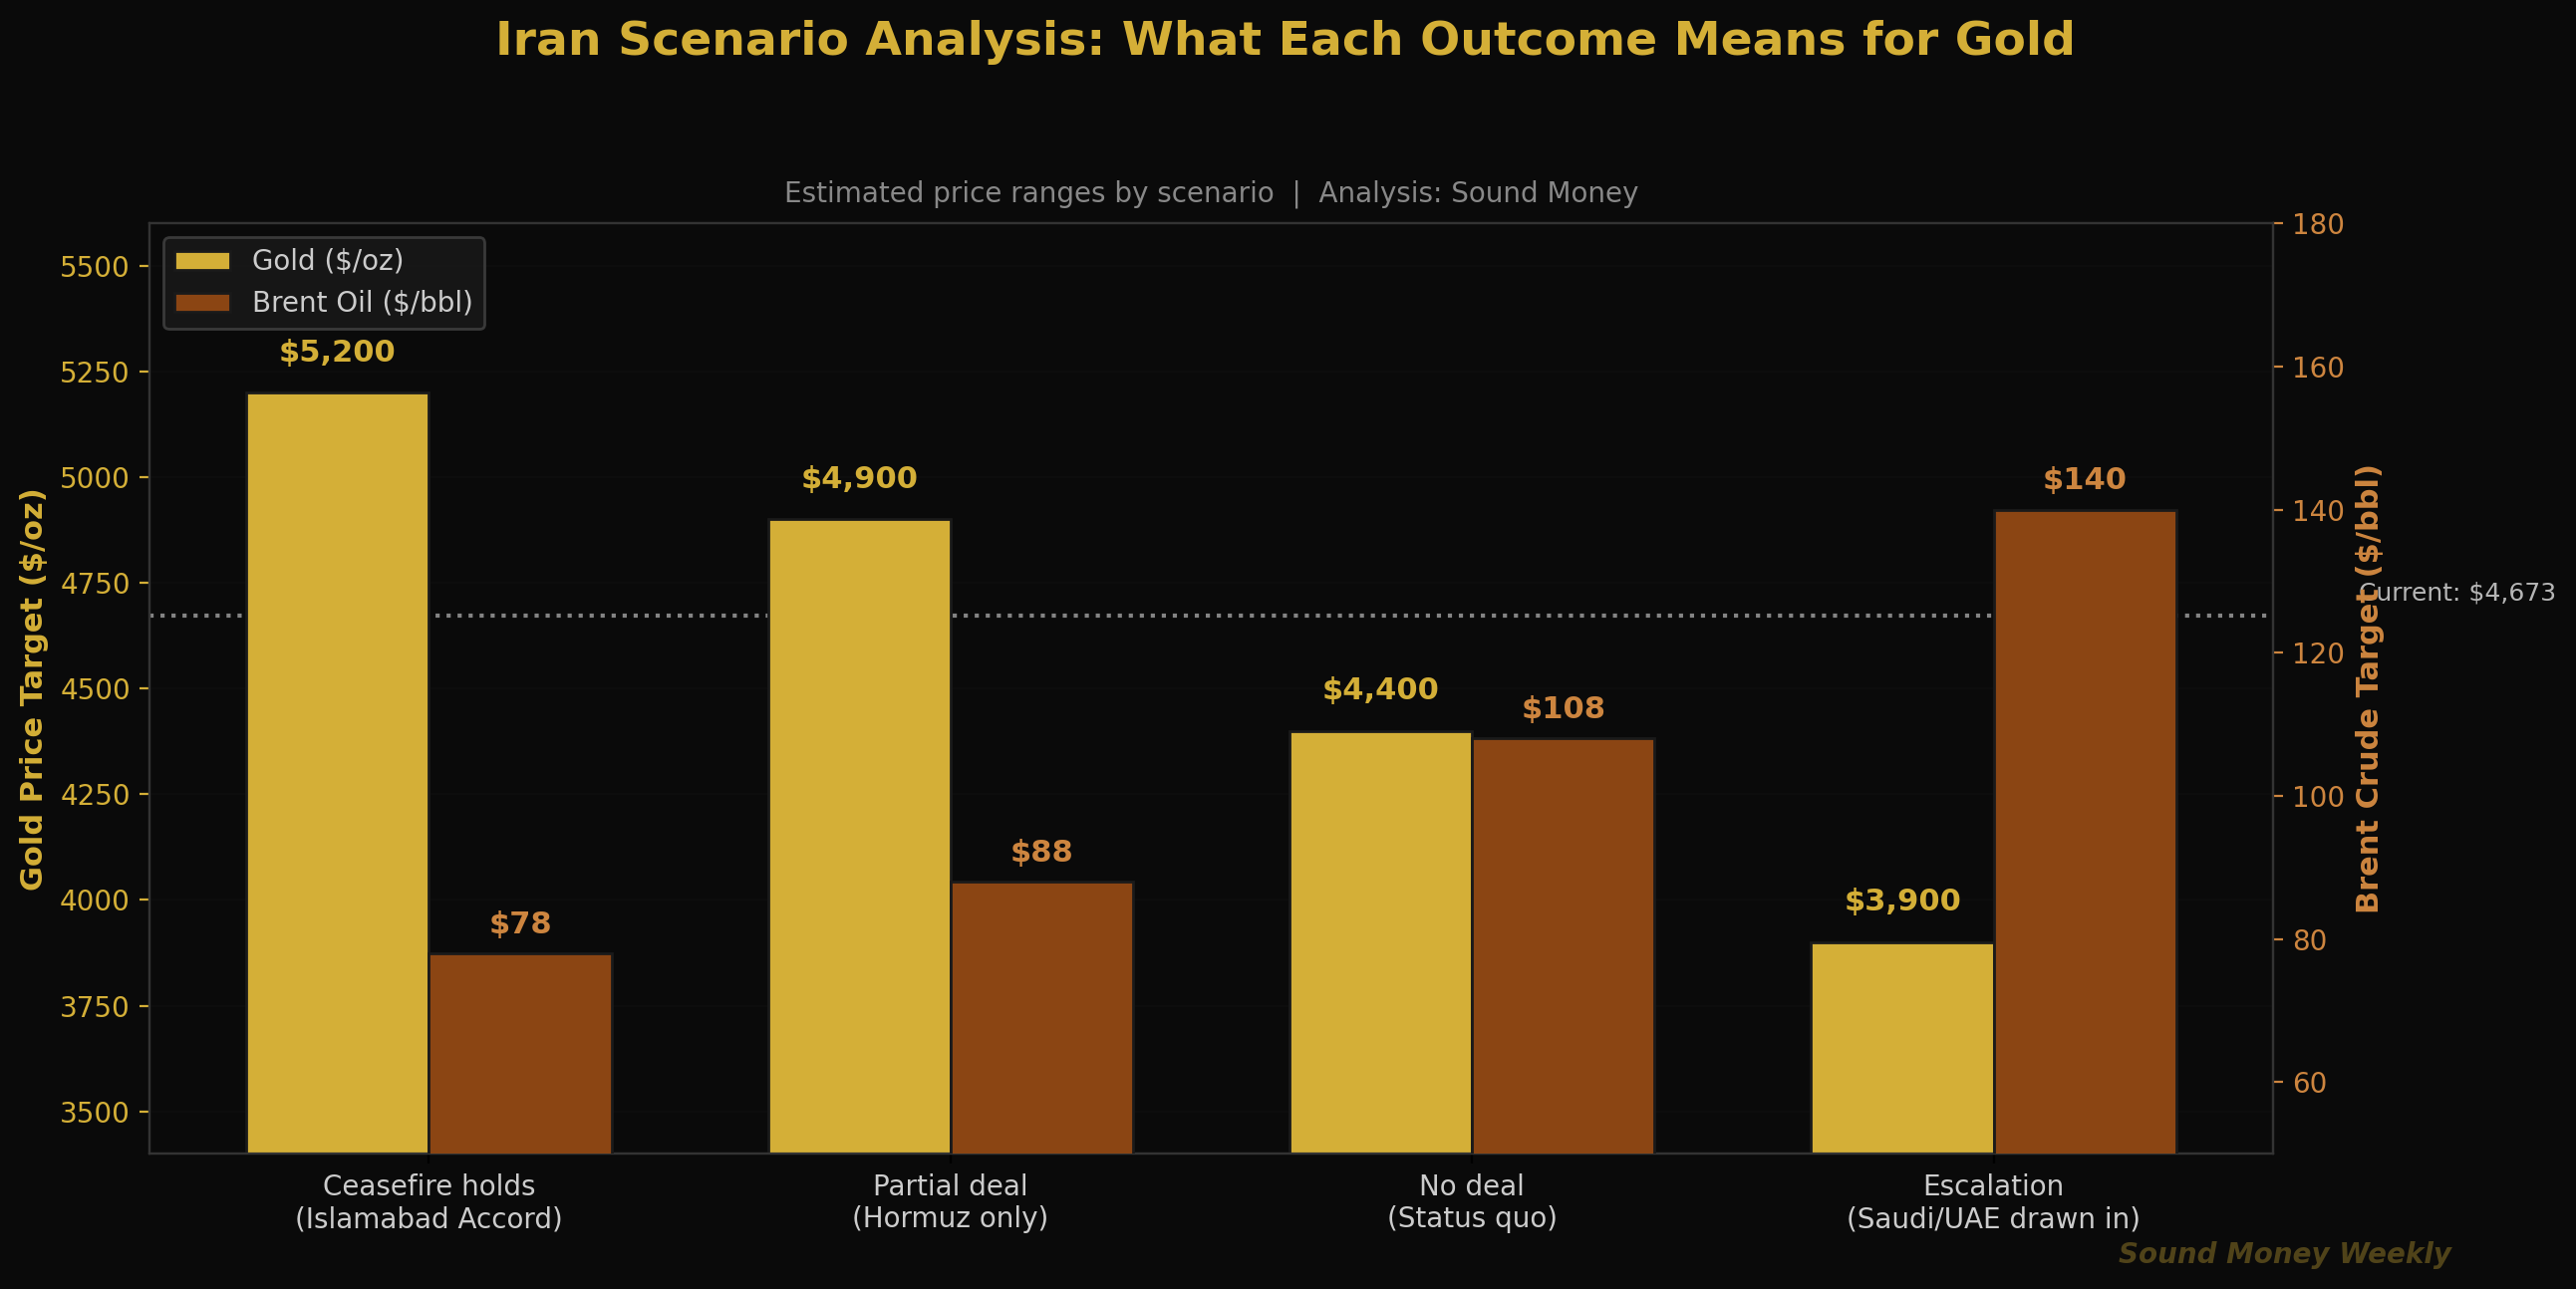
Here's how the scenarios map to gold:
| Scenario | Oil Impact | Gold Impact | Probability (our read) |
|---|---|---|---|
| Full ceasefire (Islamabad Accord) | Brent to ~$78 | Gold to $5,000-$5,200 as rate cuts return to pricing | Possible, not probable this week |
| Partial deal (Hormuz reopens, war continues) | Brent to ~$88 | Gold to $4,800-$4,900 | Most likely near-term outcome |
| No deal (status quo) | Brent stays $105-$110 | Gold range-bound $4,400-$4,700 | If talks collapse |
| Escalation | Brent to $130-$140 | Gold tests $3,900-$4,100 (rate hike scenario) | Tail risk |
The key insight: in three of four scenarios, gold goes higher from here. Only outright escalation -- the lowest-probability outcome now that diplomatic channels are actively engaged -- pushes gold materially lower.
The DCA Math This Week
At $4,673, a $200 monthly purchase buys 0.04280 ounces of gold. Here's how that compares:
| Entry Point | Price | Oz per $200 | vs. ATH |
|---|---|---|---|
| January ATH | $5,608 | 0.03566 oz | -- |
| Pre-war | $5,200 | 0.03846 oz | +7.8% more metal |
| This week | $4,673 | 0.04280 oz | +20% more metal |
| March 23 low | $4,098 | 0.04881 oz | +36.9% more metal |
Over 12 months of consistent $200/month purchases at $4,673, you accumulate approximately 0.514 ounces. If gold reaches J.P. Morgan's $6,300 year-end target, that stack is worth $3,238 -- a 35% return on $2,400 invested. At Goldman's more conservative $5,400 target, it's $2,776 -- still a 16% return.
Now consider the person who paused during March because "gold is crashing" and plans to restart "when things settle down." Gold is already 14% off its lows. If a ceasefire materializes this week, the rebound could be swift and sharp -- and the window for discounted metal closes. The Hartford Funds data is worth repeating: missing just the 10 best trading days over 30 years cuts total returns roughly in half. Those best days almost always occur during periods of maximum fear and uncertainty -- periods exactly like the one we just lived through.
The investors who turned $31,500 into $193,647 by stacking $100/month since 2000 didn't do it by predicting bottoms. They did it by never stopping. The winners in this game are always in the game.
What It Means
Here's the plain-English version.
March was brutal, but the damage is behind us. Gold's worst month since the financial crisis is in the books. The critical support levels held. The 200-day moving average held. The Fibonacci 50% held. Gold has reclaimed the 0.382 retracement and is pressing toward the 50-day moving average. The technical picture has shifted from "how low does this go" to "how fast does this recover."
Powell changed the game. The biggest threat to gold in March wasn't the Iran war -- it was the possibility that the Fed would hike rates. Powell's March 30 comments effectively took that off the table. Long-term inflation expectations are anchored. The Fed is patient. The two-year yield dropped. Rate hike odds collapsed. This is the single most bullish development for gold since the selloff began.
The ceasefire is the catalyst. If the Islamabad Accord materializes -- even in partial form -- oil drops, inflation expectations ease, rate cut hopes revive, and gold has a clear path back toward $5,000. In three of four plausible Iran scenarios, gold goes higher from current levels.
At $4,673, you're still getting discounted metal. Every $200 purchase buys 20% more gold than it did at January's all-time high. Every month you stack at these levels, you're accumulating more ounces per dollar than buyers who purchased at $5,000+. The math doesn't require a forecast. It just requires consistency.
This is not a recommendation. We don't know if the ceasefire happens this week or next month. We don't know how markets digest Friday's NFP on Monday morning. We do know that gold has delivered 10.9% annualized returns since 2000 and has never posted a negative rolling 20-year return since 1971. We know every major bank still targets $5,400-$6,300 by December. And we know that the people who stay in the game through the volatility are the ones who capture the full long-term return.
What We're Watching
Monday, April 6: NFP market reaction. The delayed Good Friday digestion creates gap risk. Gold futures indicated roughly flat/slightly higher in Sunday evening trading, but the $4,807 (50-day MA) test could come quickly if the strike-adjusted read is seen as weak.
April 8: FOMC Minutes. The full transcript from the March 18 meeting will reveal how seriously the Fed discussed rate hikes. If the minutes confirm a "hold and observe" stance rather than active tightening debate, gold rallies. If dissents or hawkish language emerge, the $4,654 support gets tested.
April 9: Iran ceasefire target date. The most consequential variable. Pakistan's two-phase framework is the most concrete proposal yet. If Hormuz reopens -- even temporarily -- oil could drop 15-20% in a single session, and gold would likely surge as rate cut expectations snap back.
April 10: March CPI. Hot CPI = hawkish repricing, gold under pressure. Cool CPI = rate cuts back on the table, gold rallies. Given the oil-driven inflation of the past month, this report carries more weight than usual.
India's ETF pricing shift. SEBI's switch from LBMA AM fixing to domestic spot pricing for gold and silver ETF NAVs took effect April 1. This is worth monitoring -- India is the world's second-largest gold consumer, and any pricing divergence could affect flows between London and Mumbai.
Until Next Week
March 2026 will be studied in gold market history the way October 2008 and April 2013 are studied today. In all three cases, the question afterward was the same: was the selloff the end of the bull market, or a violent reset within one?
In 2008, gold fell 33% and then tripled over the next three years. In 2013, the Fed was genuinely tightening, and gold didn't see new highs for seven years. The answer depended entirely on the Fed's direction.
Today, Powell has told us the Fed is patient. Long-term inflation expectations are anchored. Rate hikes are off the table. If the Iran conflict de-escalates -- and the Islamabad framework suggests it might -- the setup for the remainder of 2026 looks far more like 2008's aftermath than 2013's.
For people who stack consistently, the worst month since the financial crisis just handed them three straight weeks of discounted metal. At $4,673, every $200 buys 20% more gold than it did at the peak. Those extra ounces compound over years and decades. That's not a forecast. That's arithmetic.
The winners in this game are always in the game. See you next Monday.
Sound Money offers fractional gold and silver ownership at whole-ounce pricing -- no minimums, no premiums. Learn more at sound.money.
Disclaimer: This content is provided by Sound Money for educational and informational purposes only. Nothing published here constitutes investment advice, financial advice, trading advice, or any other form of professional advice. Sound Money is not a registered investment advisor, broker-dealer, or financial planner. The information presented reflects our analysis of publicly available data and should not be relied upon as a basis for investment decisions. Precious metals investments carry risk, including the potential loss of principal. Past performance does not guarantee future results. Always consult a qualified financial advisor before making investment decisions. For more information about Sound Money's products and services, visit sound.money.
- gold
- silver
- precious-metals
- fed
- powell
- iran
- ceasefire
- nfp
- dca
- weekly-update