The Oil Shock That Was Bad for Gold — and the CPI Print That Changed Everything
An Iran oil shock knocked gold below $4,000. Then June CPI came in at 3.5% — the biggest disinflationary monthly print since 2020. Here's what both mean.
Most investors assume a Middle East oil crisis is automatically bullish for gold. Crisis = safe haven. Crisis = gold up.
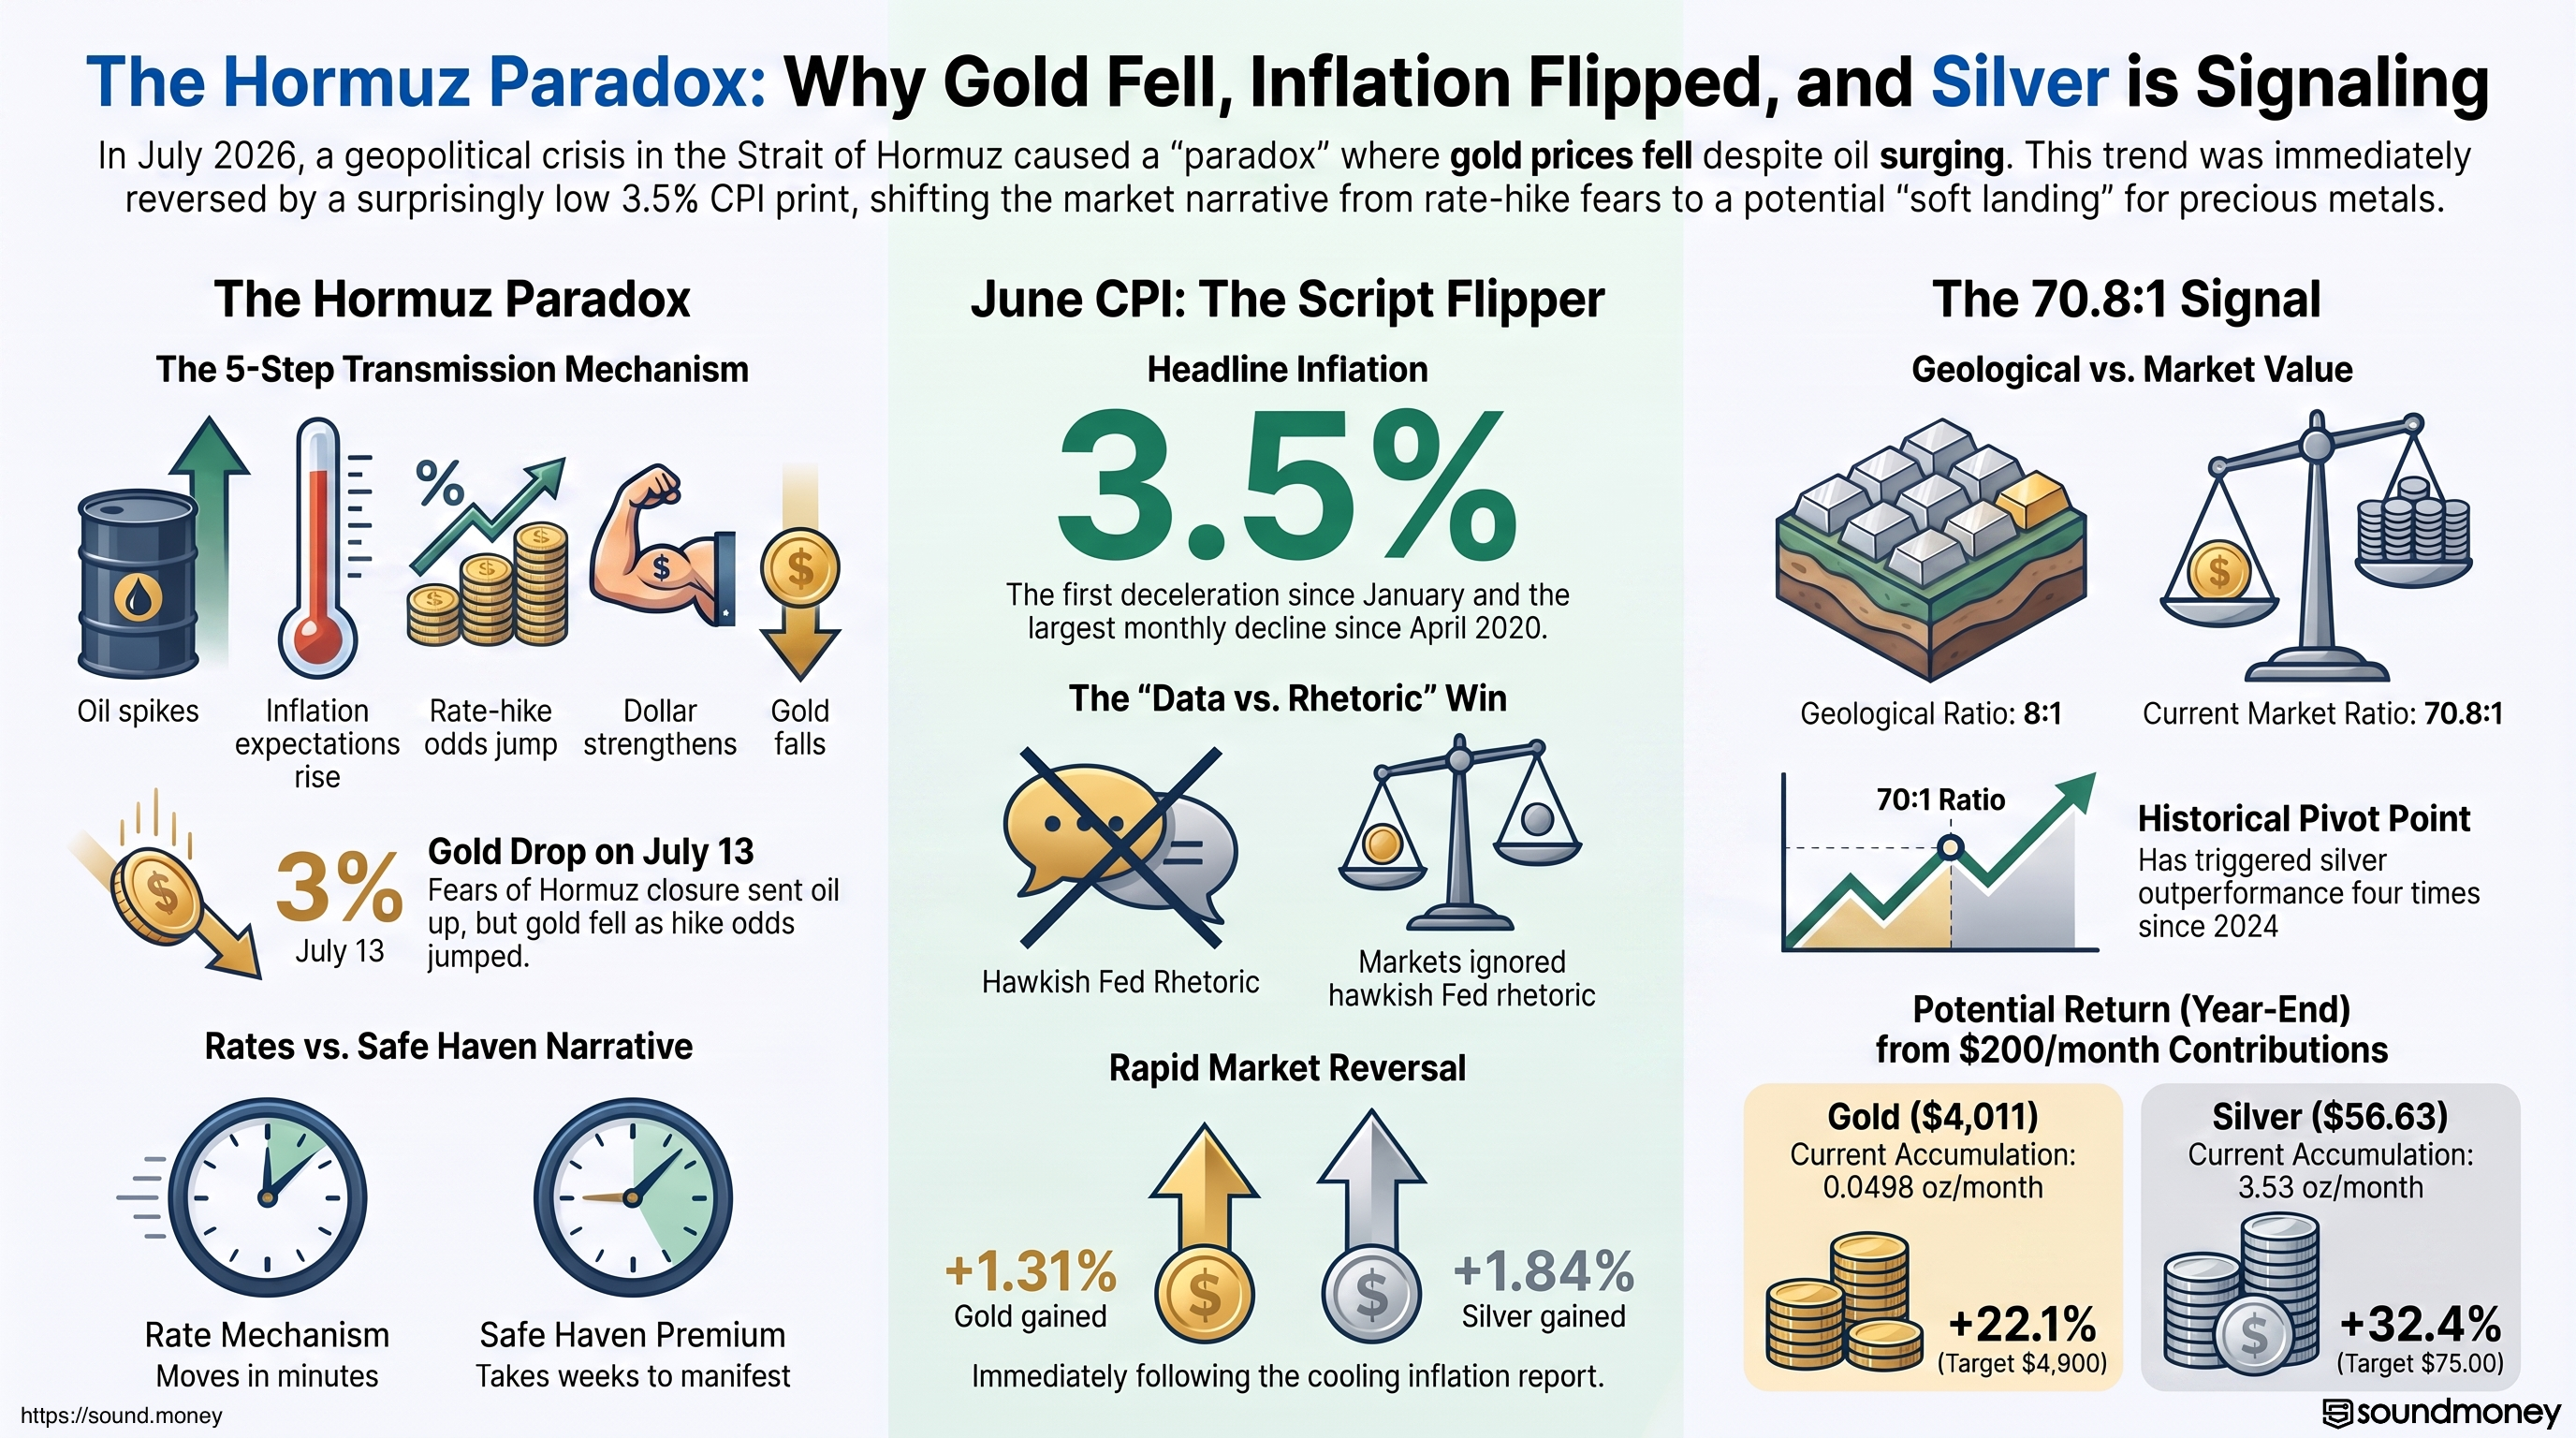
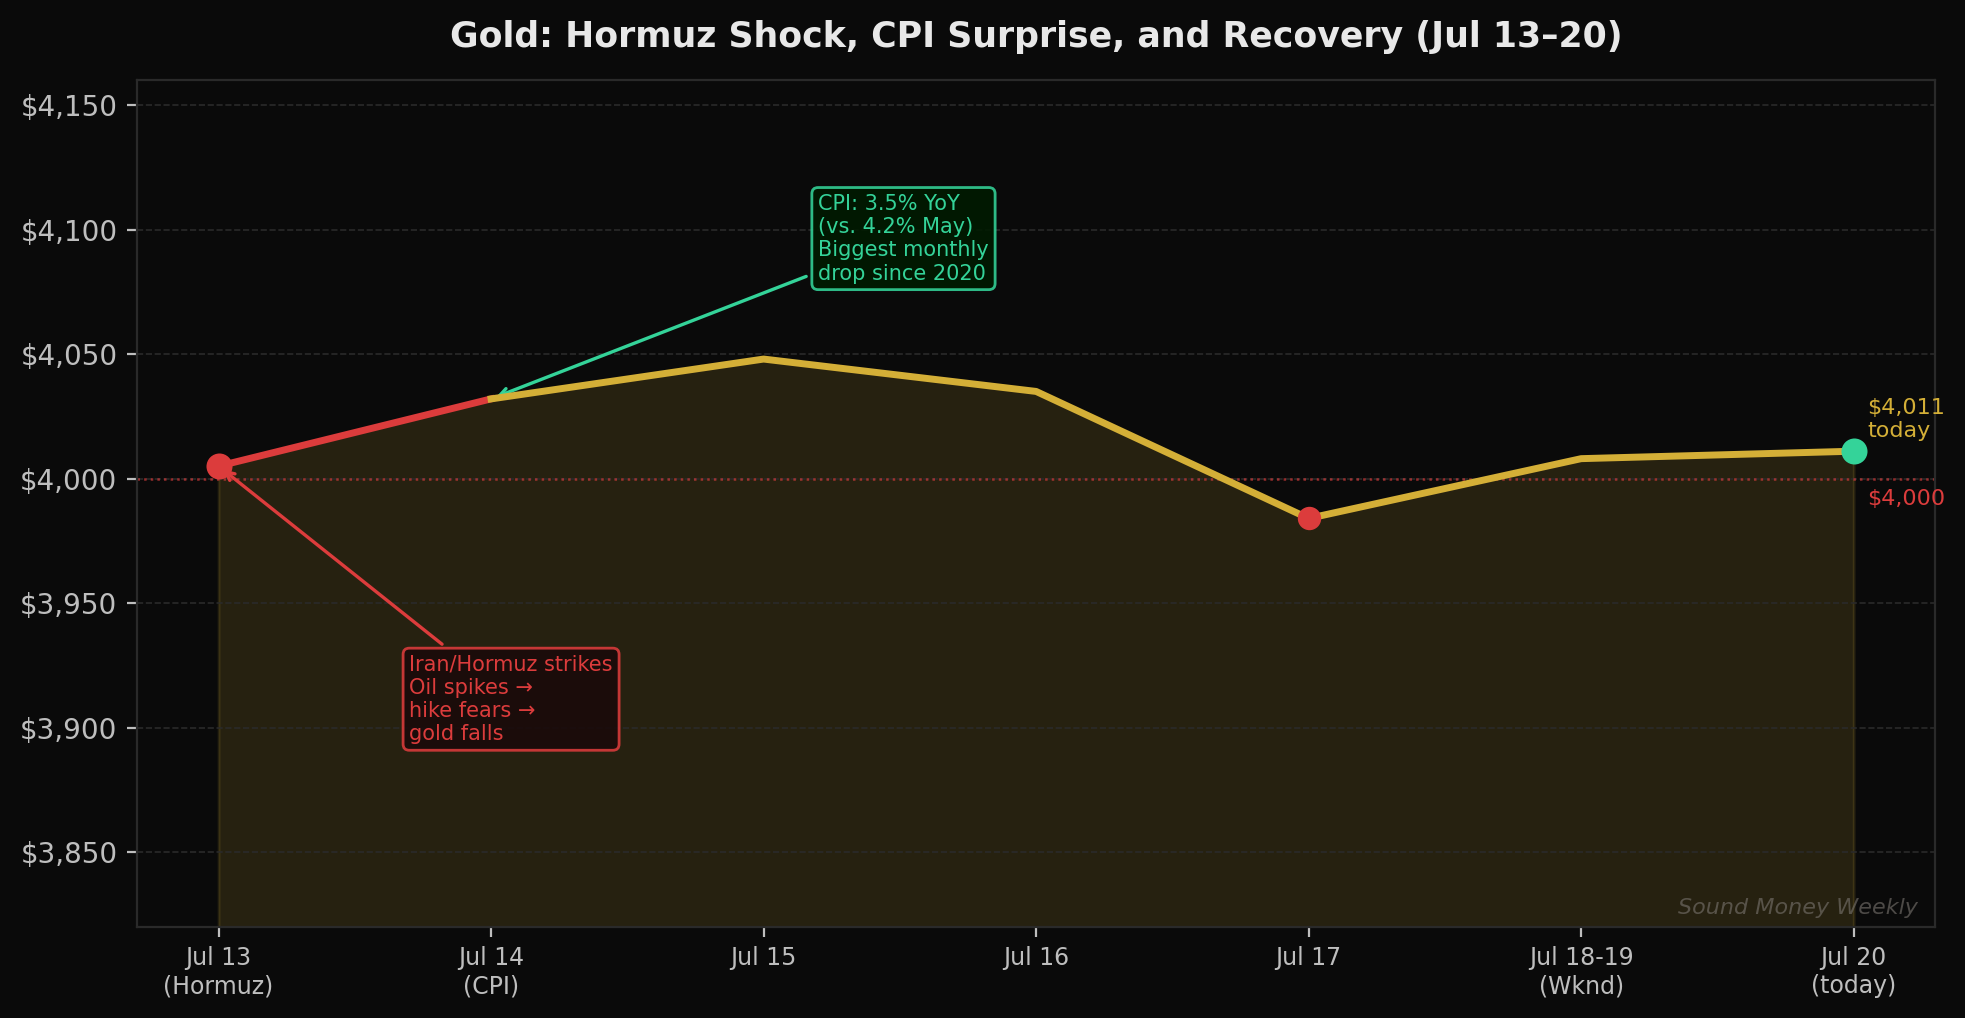
Last Monday, the Strait of Hormuz flared, oil spiked, and gold fell nearly 3%.
Then, the next morning, the Bureau of Labor Statistics released June CPI — and it was the most disinflationary monthly print since April 2020. Gold recovered. The rate narrative shifted. And the gold-silver ratio, sitting at 70.8:1, is now flashing a historical signal that's worth understanding.
This week had three distinct data points. Each tells part of the same story.
The Hormuz Paradox: Why the Oil Shock Was Bearish for Gold
On July 13, reports of US-Iran strikes and fears of a partial Strait of Hormuz closure sent crude oil surging. Gold, which most people would expect to rally on such news, fell nearly 3%. July FOMC rate-hike odds jumped from 34% to 43% in a single session.
This is the Hormuz Paradox — and understanding it is fundamental to reading gold's price action in 2026.
Here is the transmission mechanism:
- Oil spikes on Hormuz closure fears → crude up, energy prices surge
- Inflation expectations rise — traders price in a second-wave energy inflation shock hitting CPI in coming months
- Rate-hike probability increases — the CME FedWatch tool responds to repriced inflation expectations
- Dollar strengthens — higher expected rates make dollar assets more attractive
- Gold falls — as a non-yielding asset priced in dollars, gold is mechanical hurt by a stronger dollar and rising real yields
The paradox is that the geopolitical crisis mechanism and the rate mechanism work in opposite directions. Gold's "safe haven" narrative is real — but it plays out over weeks and months, not hours. The rate mechanism plays out in minutes. On the day of the Hormuz shock, rates won.
This isn't unique to July 2026. Historically, the oil-shock-to-gold transmission follows the same path: if the market believes the oil spike will be inflationary and the Fed will respond hawkishly, gold declines despite the crisis. If the oil shock is seen as growth-destroying rather than inflationary — as in 2008 — gold eventually rallies as rate-cut expectations rise. The difference is what the oil shock does to the rate outlook.
In the current environment, with Warsh signaling "no tolerance for elevated inflation," any development that refreshes inflation expectations is treated as a rate-hike signal first. The safe-haven premium layers on later, if at all.
June CPI: 3.5%. The Script Just Flipped.
Twenty-four hours after the Hormuz oil shock, the BLS released June's Consumer Price Index.
The headline: CPI rose 3.5% year-over-year in June — down sharply from May's 4.2%, below the 3.8% consensus, and the first deceleration since January. Month-over-month, prices fell 0.4% — the largest monthly decline since April 2020, the first month of COVID lockdowns.
Core CPI (excluding food and energy) came in flat for the month, with a 2.6% year-over-year rate — below both the 2.8% consensus and May's 2.9% reading. The report undershot expectations on every line that matters.
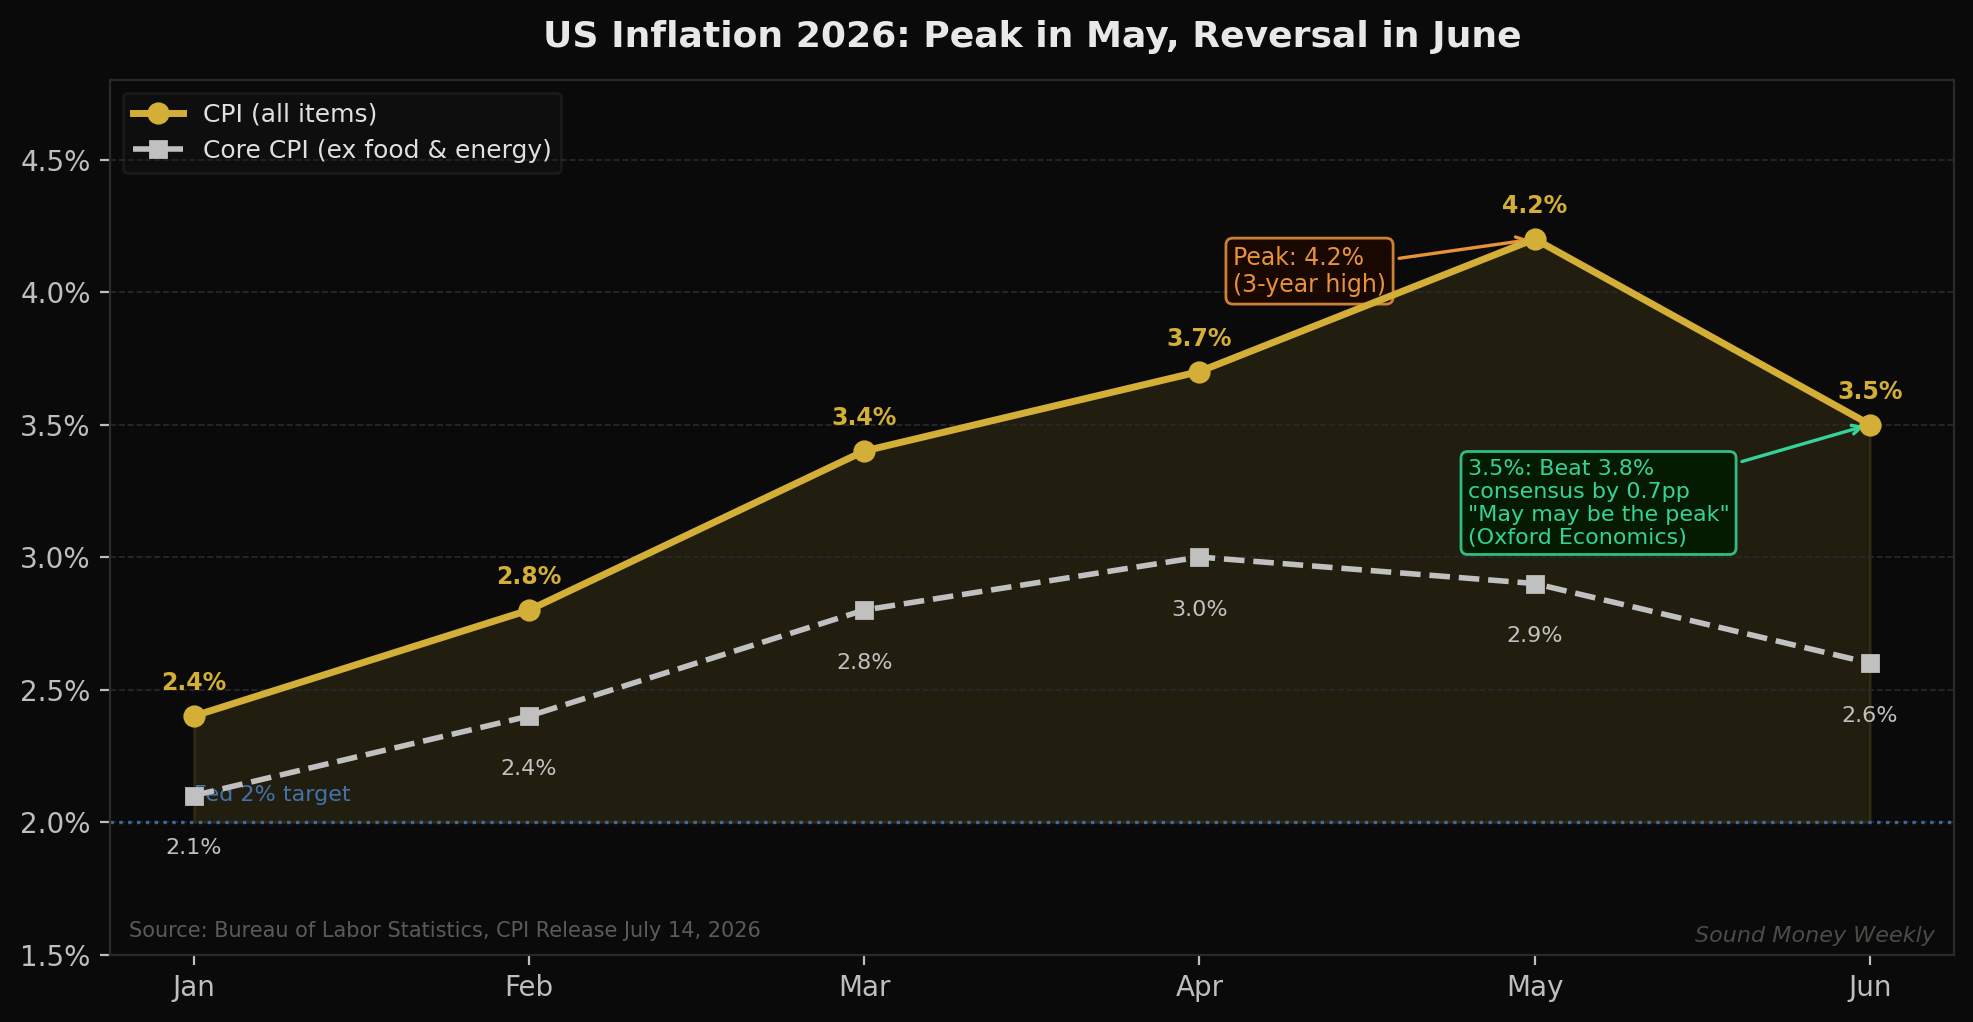
The driver was energy. Gasoline prices fell 9.7% in June — the tail of crude oil's decline that pre-dated the Hormuz flare-up. Oxford Economics stated plainly that May may represent 2026's peak inflation reading.
Markets responded immediately. The dollar fell. Gold and silver recovered — COMEX gold gained 1.31%, silver 1.84% on July 15. July FOMC rate-hike probability dropped back from 43% toward 25%. More importantly, December hike probability — which had been running at 87% — dropped materially.
The irony of July 14 is worth noting: Kevin Warsh testified before the House Financial Services Committee the same morning CPI printed, telling lawmakers the Fed has "no tolerance for persistently elevated inflation." He said this on the morning that inflation printed the largest single-month decline since the pandemic. The data and the rhetoric landed simultaneously, and the data won.
After today's June CPI reading, it appears less likely the FOMC will raise rates at its next several meetings, according to US News & World Report. That directly unwinds the Hormuz shock's rate-hike premium that had pushed gold below $4,000.
The 70.8:1 Signal
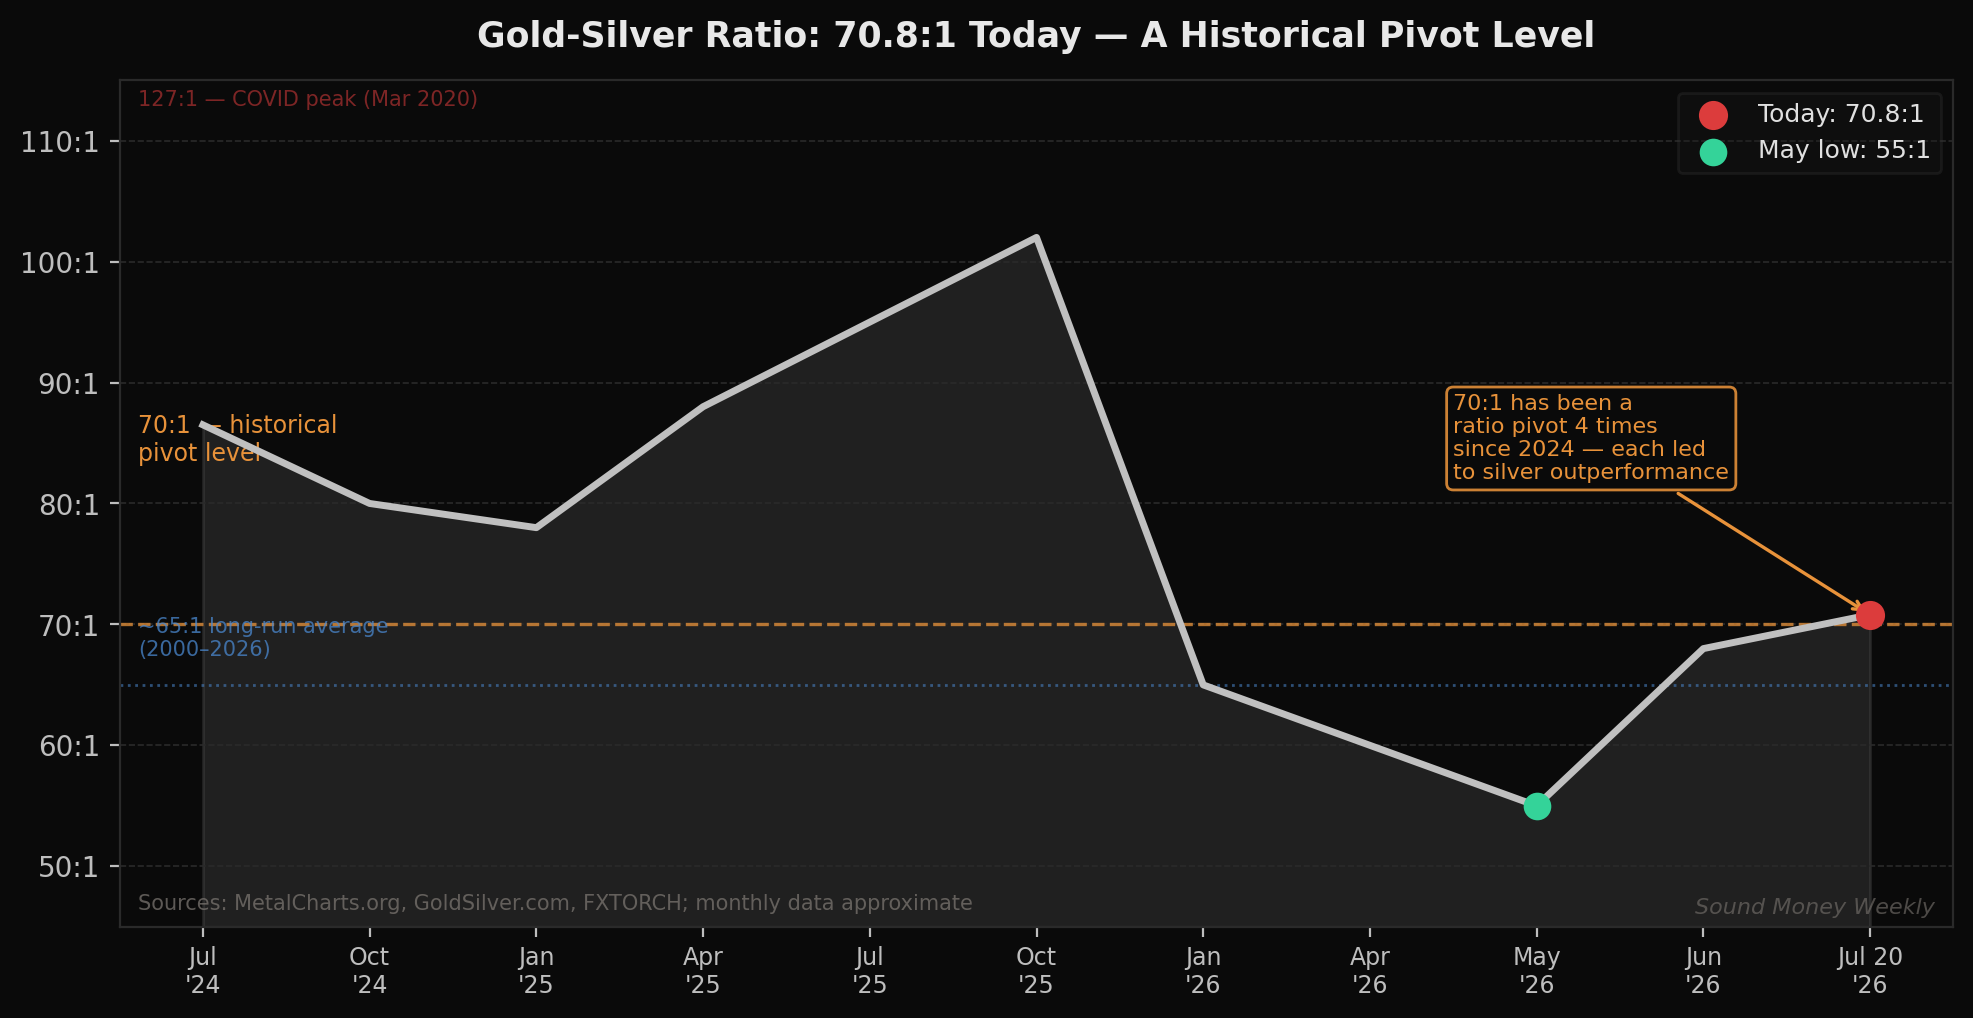
Gold is at $4,011 today. Silver is at approximately $56.63. That puts the gold-silver ratio at 70.8:1 — meaning one ounce of gold buys more than 70 ounces of silver.
Most people don't track the gold-silver ratio. Here's why they should.
Silver and gold are mined from the earth at roughly an 8:1 geological ratio — for every ounce of gold extracted, approximately 8 ounces of silver come with it. The market is currently pricing them at 70.8:1. That is nearly nine times the geological extraction ratio.
The long-run market average for the ratio, going back to 2000, sits approximately at 65:1. The current 70.8:1 reading represents silver trading at a meaningful discount to its historical value relative to gold.
More importantly for the near-term outlook: the 70:1 level has functioned as a pivot point four times since 2024. Each time the ratio tested 70 or above, it reverted — with silver outperforming gold in the subsequent 2-4 weeks. The most recent episode saw the ratio spike to 71.2 before collapsing to 66.8 within two weeks, a move that corresponded with silver rallying over 8%.
That doesn't guarantee the pattern repeats. But with the June CPI removing the primary macro headwind (rate-hike expectations), and the ratio again at 70.8, the setup for silver relative to gold is structurally similar to the prior pivot episodes.
What It Means for the DCA Investor
The week's three-part story — oil shock, CPI relief, ratio signal — is actually a single coherent narrative when you step back.
The Hormuz shock created the $3,984 low on July 17. The CPI print removed the primary justification for the rate-hike premium that was capping gold. And the 70.8:1 ratio says that if gold recovers toward institutional targets, silver will likely recover more, on a percentage basis.
At $4,011 today:
- $200/month buys 0.04986 oz — nearly 5 cents of an ounce on a $200 commitment
- Compared to January's $5,608 ATH: 39.9% more metal per dollar — the highest DCA efficiency since early 2026
- Over 12 months at $200/month: 0.5982 oz accumulated on $2,400 total invested
- At Goldman's year-end target of $4,900: that position is worth $2,931 — a +22.1% return on monthly contributions
If you're adding silver alongside gold, the math is even more striking. At $56.63/oz, $200 buys 3.53 ounces of silver — more than three full ounces on a single monthly contribution. Annual accumulation: 42.3 ounces. At JPMorgan's silver target of $75: worth $3,173 on $2,400 invested.
The ratio is the signal. The CPI is the catalyst removal. The DCA math at both metals is the execution framework.
What We're Watching
July 28–29 FOMC — Warsh's Second Meeting
Post-June CPI, the market has largely repriced a July hold as a certainty. What Warsh says about the data — and whether he acknowledges that May's 4.2% may have been the peak — will be the story. If his statement tone softens, or if he leaves the door open to rate cuts later this year, gold could see a meaningful relief rally. If he stays hawkish despite the data, the September decision becomes the critical moment.
July CPI — August 12
June's soft print raises the question: was this a one-month energy effect or the beginning of a sustained deceleration? Oil prices have since re-spiked on the Hormuz news, so July's energy component may partially reverse. Core inflation — which was flat in June — will be the cleaner signal.
The Hormuz Situation: Still Live
The Strait of Hormuz carries approximately 20% of global oil supply. The July 13 escalation has not fully resolved. If the situation deteriorates, the oil-to-rates-to-gold chain reasserts itself. The next session that oil gaps higher on Hormuz news is the session gold may fall again on the same paradox.
Understanding the mechanism — rather than reacting to the narrative — is what separates disciplined accumulation from emotional market reaction.
The Bottom Line
An oil shock was bearish for gold because it was inflationary in theory — even as actual June inflation came in at its lowest monthly reading in more than five years. The data matters more than the narrative, and the data said 3.5%.
Gold is at $4,011. The rate premium that had gold pinned has partially deflated. The gold-silver ratio is at a historical pivot level. Every major bank's revised year-end target still sits between $4,600 and $4,900.
The week's complexity resolves simply: the macro headwind just got lighter. The structural demand case — central banks, physical delivery, PBOC on a 20-month streak — never changed. The DCA math is better now than it was in January.
This article is for informational purposes only and does not constitute investment advice. Past performance of gold and silver prices is not indicative of future results. Always conduct your own research and consult a qualified financial advisor before making investment decisions. Sound Money provides fractional precious metals ownership services — see sound.money for full terms and conditions.
- gold
- silver
- precious-metals
- cpi
- inflation
- iran
- federal-reserve
- gold-silver-ratio
- dollar-cost-averaging