Gold just posted its worst week since 1983. Every major bank still targets higher. Here's what happened, what it means, and why the DCA math just got more interesting.
Gold's Worst Week Since 1983: A Stress Test for the Bull Market
Sound Money Weekly | March 25, 2026
The Hook
Gold dropped 11% last week — its worst weekly performance since 1983. Silver fell even harder, plunging roughly 16% from Monday to Friday. On Monday March 23, gold flash-crashed to an intraday low of $4,098 — nearly 27% below January's all-time high of $5,608. By the time markets opened Wednesday morning, the panic had evaporated: gold surged 3.47% to $4,568 and silver bounced 3.52% to $72.60, snapping a nine-day losing streak.
The headlines were dramatic. The underlying data is more nuanced. And the structural thesis that made gold the best-performing major asset of the past two decades hasn't changed. Let's walk through what actually happened, what the technical picture looks like, and what we're watching next.
How We Got Here: A Week in Seven Days
The selloff didn't come from nowhere. Gold had already corrected 10% from its January all-time high before the week began. What turned a normal pullback into a historic rout was a specific chain of events — each one feeding the next.
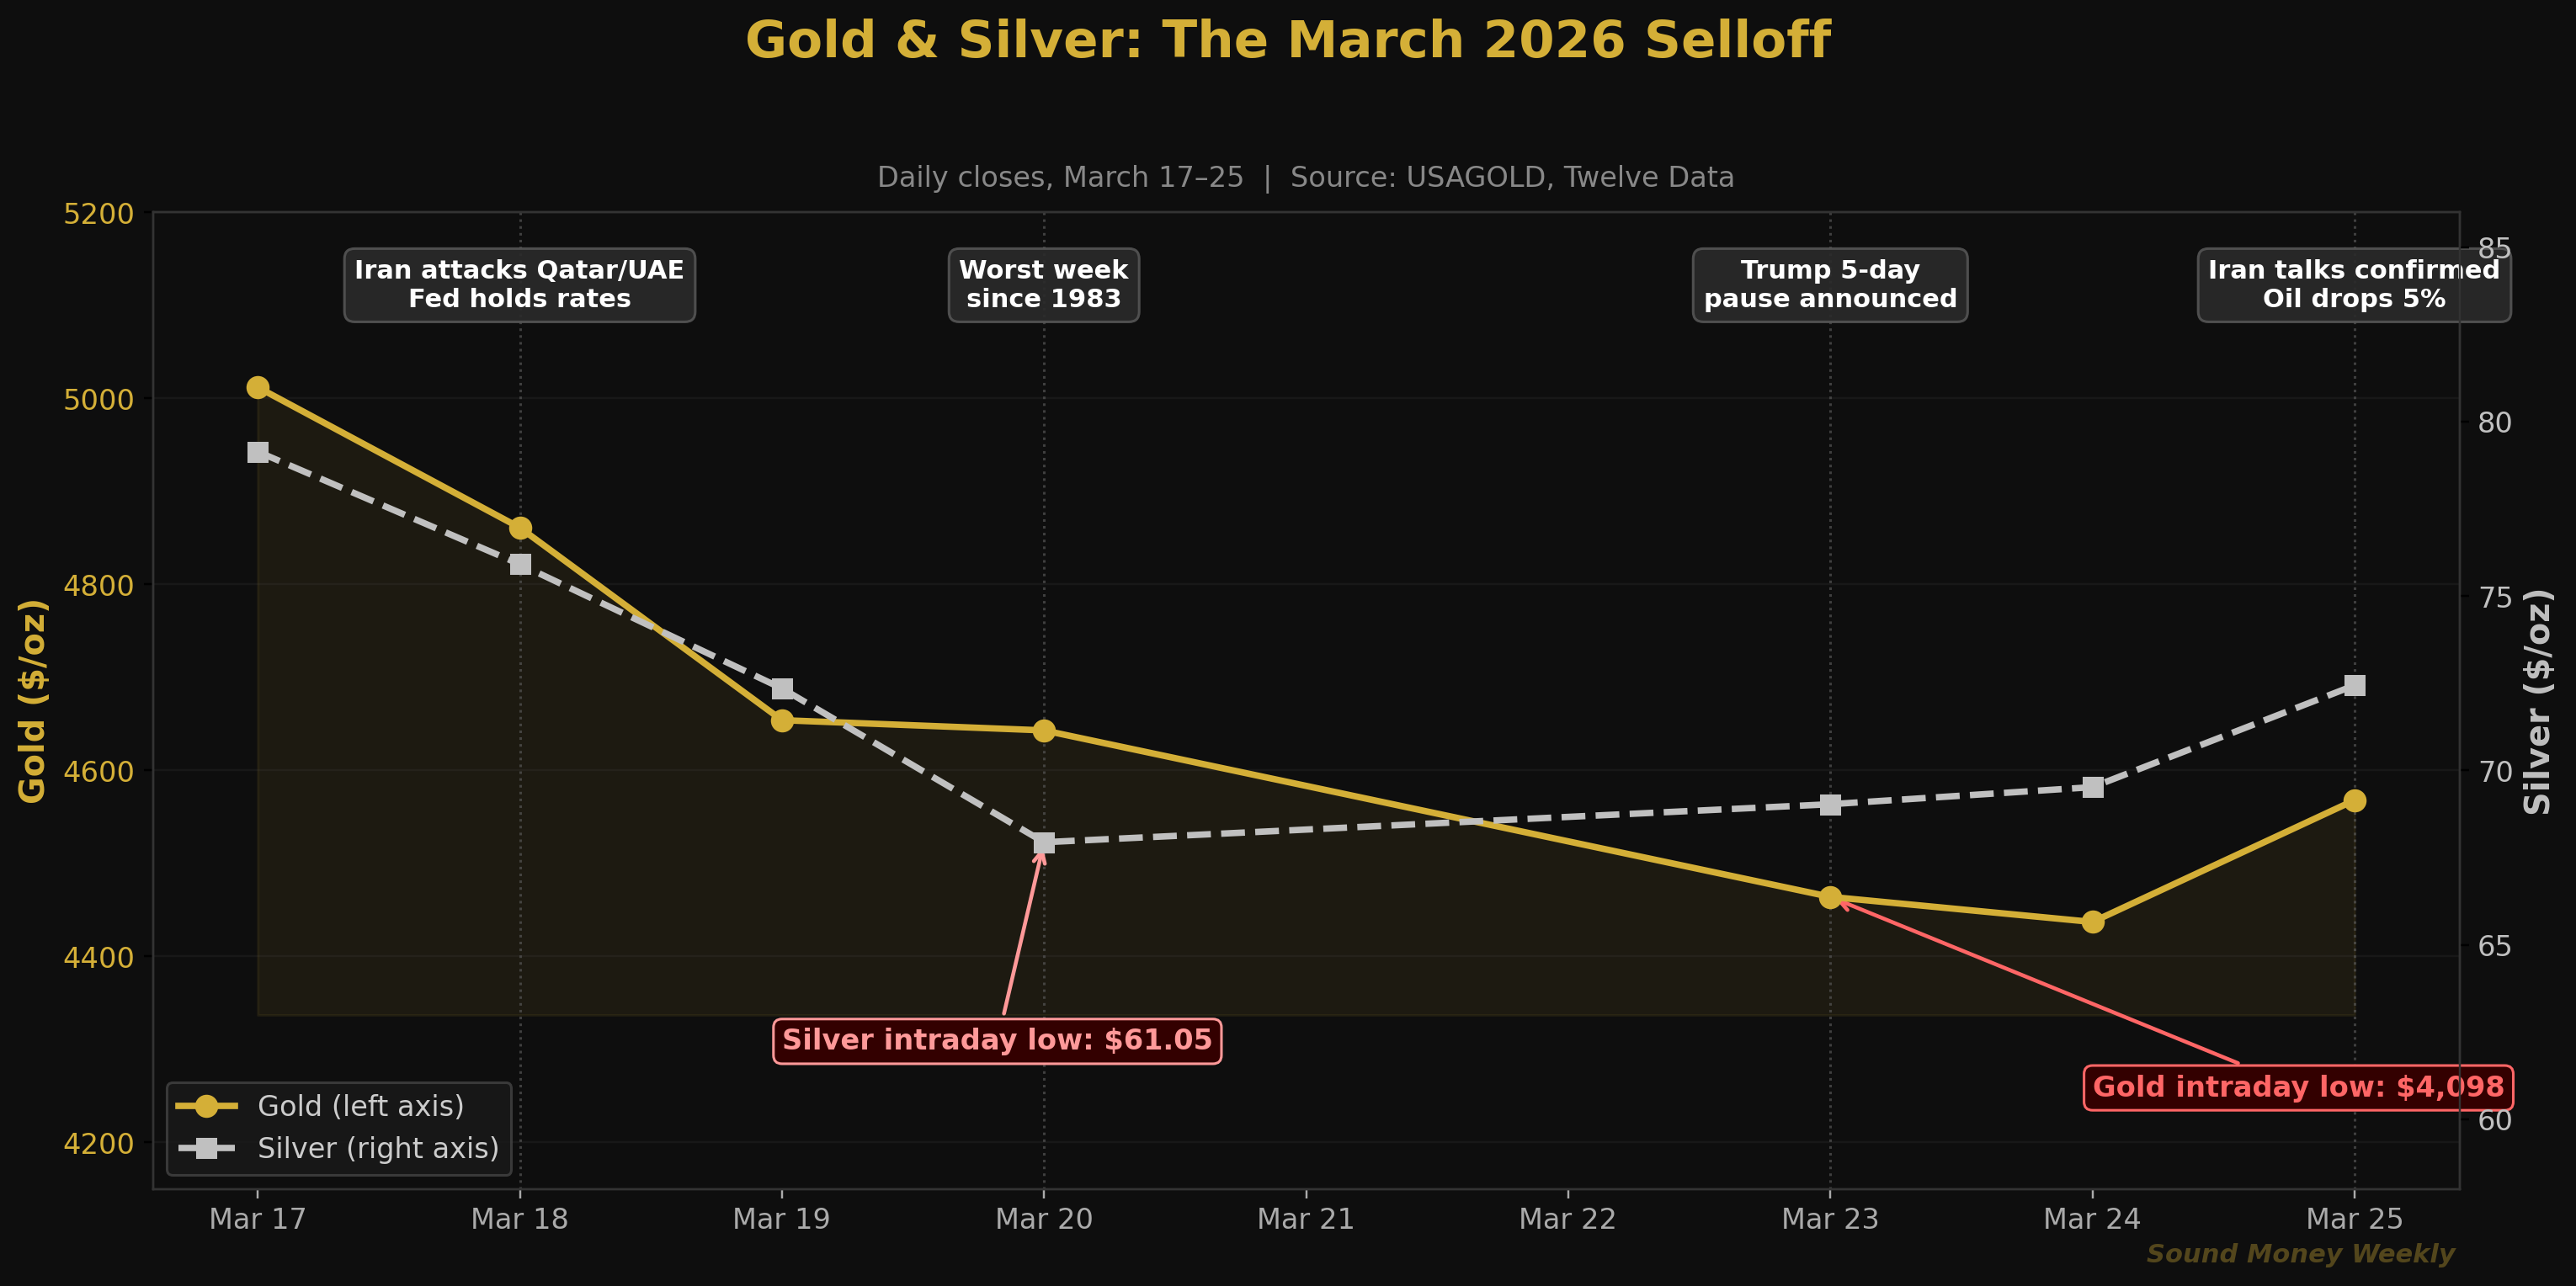
Tuesday, March 18 — Iran launched retaliatory strikes against oil and gas facilities in Qatar, Saudi Arabia, and the UAE following an Israeli airstrike on Iran's South Pars gas field. Brent crude spiked above $108/barrel. The Federal Reserve held rates at 3.50–3.75%, citing "uncertain" effects of the conflict. Gold fell 3%.
Wednesday–Thursday, March 19–20 — The damage compounded. With Brent above $107, inflation expectations surged and traders repriced the Fed from "multiple cuts in 2026" to "possible hike by October," per Bloomberg data cited in TheStreet. The Dollar Index (DXY) climbed to 99.9. The 10-year Treasury yield hit 4.2%. Gold closed Friday at approximately $4,497 — down 11% for the week.
Monday, March 23 — The most dramatic session. Gold opened lower, then flash-crashed to $4,098 intraday as algorithmic CTA funds capitulated on long positions — the first such capitulation since February 2024, according to TD Securities strategist Daniel Ghali. Silver touched $61.05 — a flash-crash low, 49% below its January high. Both recovered sharply after Trump announced a five-day pause on planned strikes on Iranian energy infrastructure.
Wednesday, March 25 (today) — Gold jumped 3.47% to $4,568 as Trump confirmed negotiations with Iran were underway. Iran signaled "non-hostile" vessels could transit the Strait of Hormuz. Brent crude dropped 5% to just below $100/barrel. The oil-to-inflation-to-rates transmission mechanism that crushed gold began to reverse.
What Caused It: The Oil → Inflation → Rates Channel
This wasn't a gold story. It was an oil story that ricocheted into gold.
Iran's effective blockade of the Strait of Hormuz — through which roughly 20% of global seaborne oil flows — created what the IEA described as the "largest global oil supply disruption in history". Brent crude surged 60% in a single month, from $67.60 in mid-February to above $112 by mid-March. Tanker transits through the Strait fell from 150+ vessels per day to as few as 13.
That oil spike rewired the entire macro landscape:
- Inflation expectations surged. Skyrocketing energy costs fed into every corner of the economy. Core PPI was already running hot (+0.8% month-over-month in January), and oil above $100 poured gasoline on the fire.
- The Fed went from "when do we cut?" to "do we hike?" Traders priced in a 50% probability of a rate hike by October, per Bloomberg. June and July cuts evaporated. The 10-year yield rose to 4.2%, increasing the opportunity cost of holding non-yielding gold.
- The dollar strengthened. DXY hit 99.9, a 2% gain since the war began. A stronger dollar makes gold more expensive for non-US buyers, suppressing demand.
- Leveraged longs capitulated. CTA algorithmic funds hit their technical thresholds and dumped positions. Gulf state sovereign wealth funds reportedly shifted from accumulation to active liquidation to fund capital defense. SPDR Gold Shares (GLD) saw more than $6 billion in outflows over three weeks, including the largest single-day outflow in a decade.
Tracy Shuchart, senior economist at NinjaTrader, summarized it bluntly: "They sold off because the war broke the rate cut thesis. The Hormuz crisis has directly influenced inflation predictions, delaying anticipated rate cuts, bolstering the dollar, and adversely impacting leveraged gold positions."
Pepperstone strategist Dilin Wu offered the most useful framing for long-term holders: "This sharp decline reflects a confluence of factors: large-scale risk asset liquidations, a hawkish shift in Fed expectations, and a stronger dollar. This is a pricing logic adjustment rather than a reversal of the long-term trend."
A pricing logic adjustment. Not a reversal. That distinction matters.
Under the Hood: The Technical View
This section is for readers who want the raw levels, ratios, and data tables. For the plain-English takeaway, skip to "What It Means" below.
Where Gold Sits on the Fibonacci Map
The selloff blew through two major Fibonacci retracement levels before finding support. Here's the framework, anchored from the January $5,608 ATH to the September 2025 rally origin at $3,120 (The Gold Forecast via Kitco):
| Fib Level | Price | Status |
|---|---|---|
| 0.0 (ATH) | $5,608 | January peak |
| 0.236 | $5,016 | Broken March 18 |
| 0.382 | $4,654 | Broken March 20 |
| 0.500 | $4,361 | Next critical test — "the fulcrum" |
| 0.618 | $4,068 | Bear case; nearly tested March 23 ($4,098 low) |
| 200-Day MA | ~$4,150–$4,200 | Bull/bear dividing line |
Gold's March 23 intraday low of $4,098 came within striking distance of the 0.618 level ($4,068) and the 200-day moving average (~$4,150–$4,200). OneUp Trader's March 24 analysis called the 200-day MA "the most important level for bulls to maintain." It held.
Today's bounce to $4,568 has reclaimed the 50% retracement zone. The 50-day MA sits at roughly $4,800–$5,000 — now overhead resistance after serving as support earlier in the year. Gold is in a no-man's-land between $4,361 (the fulcrum) and $4,654 (the broken 0.382 level).
Gold Corrections in Context
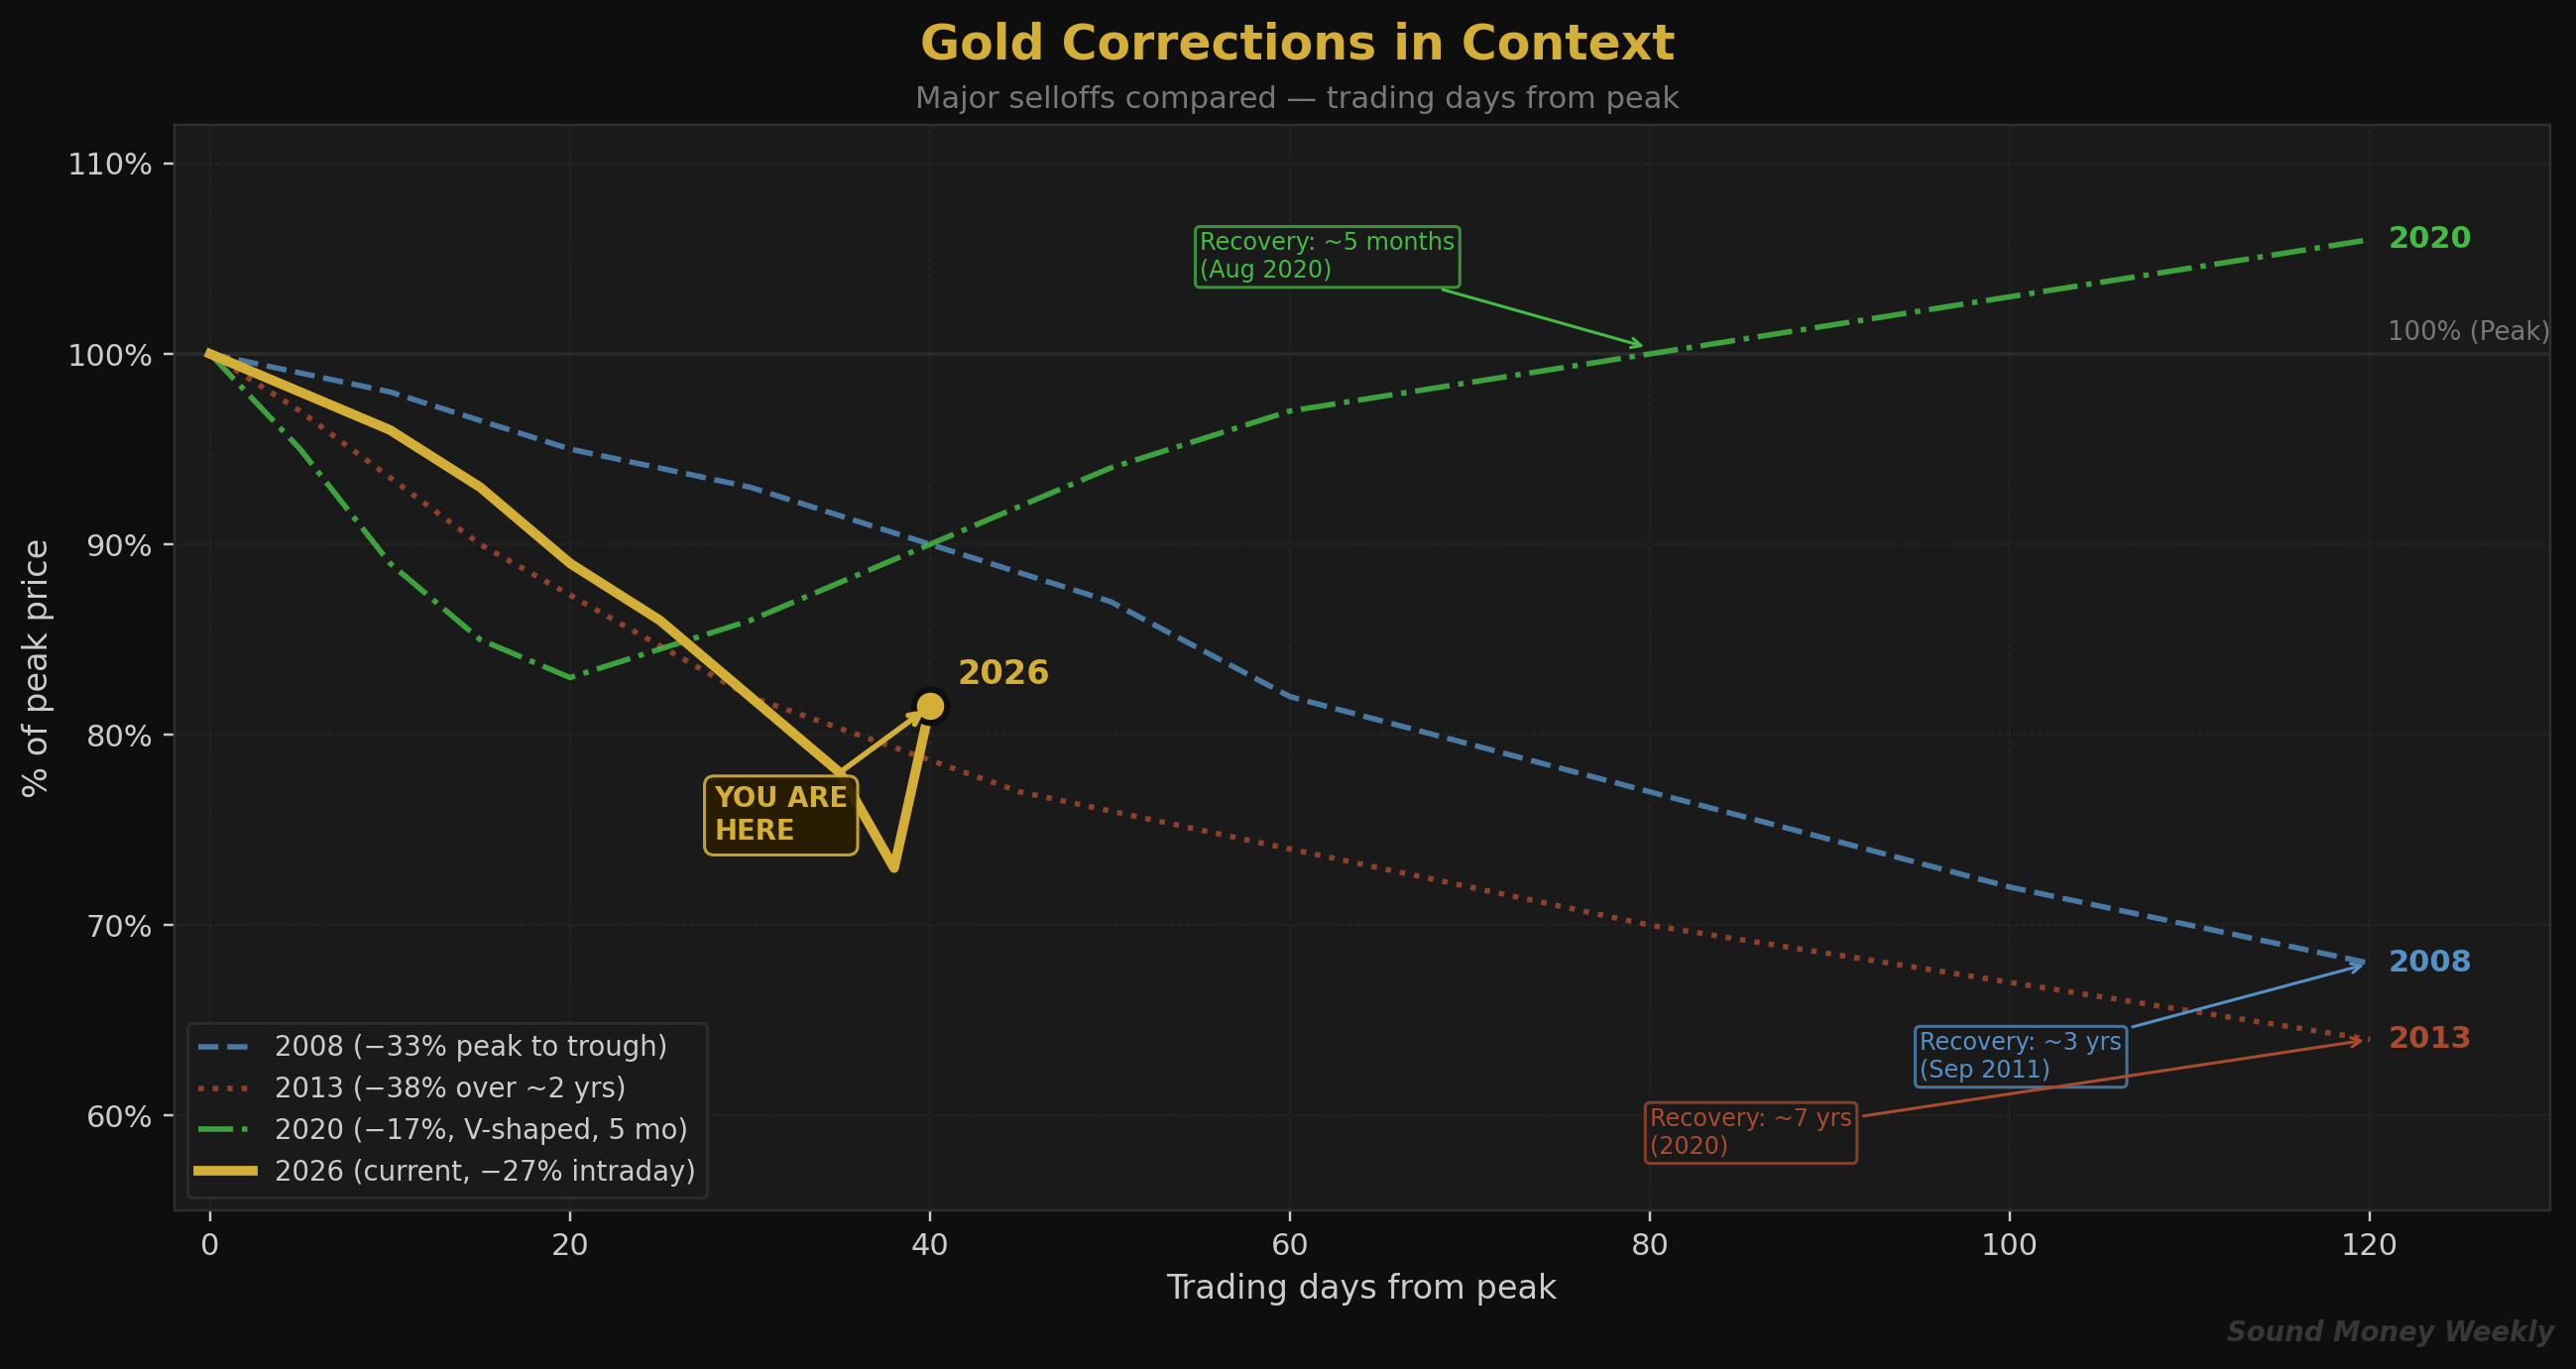
This is not the first time gold has sold off sharply during a structural bull market. Here's how prior episodes played out:
| Episode | Peak-to-Trough Drop | Cause | Time to New ATH |
|---|---|---|---|
| 2008 Financial Crisis | −33% | Liquidity panic; forced selling | ~3 years (Sept 2011) |
| 2013 Taper Tantrum | −38% over 2 years | Fed hawkish shift; real yield surge | ~7 years (2020) |
| 2020 COVID Crash | −17% | Pandemic liquidity panic | ~5 months (Aug 2020) |
| 2026 Iran Crisis | −27% intraday | Oil shock → inflation → rates reprice | TBD |
Sources: Gainesville Coins, BullionVault, TheStreet
The critical variable is the Fed's direction. In 2020, the Fed immediately pivoted to emergency easing — gold recovered in five months. In 2013, the Fed was tightening — gold didn't see new highs for seven years. Today's outcome hinges on whether the Iran conflict resolves (oil drops → inflation eases → rate cuts return → gold recovers fast) or escalates (oil stays high → Fed hikes → prolonged correction).
Wall Street Still Targets Higher
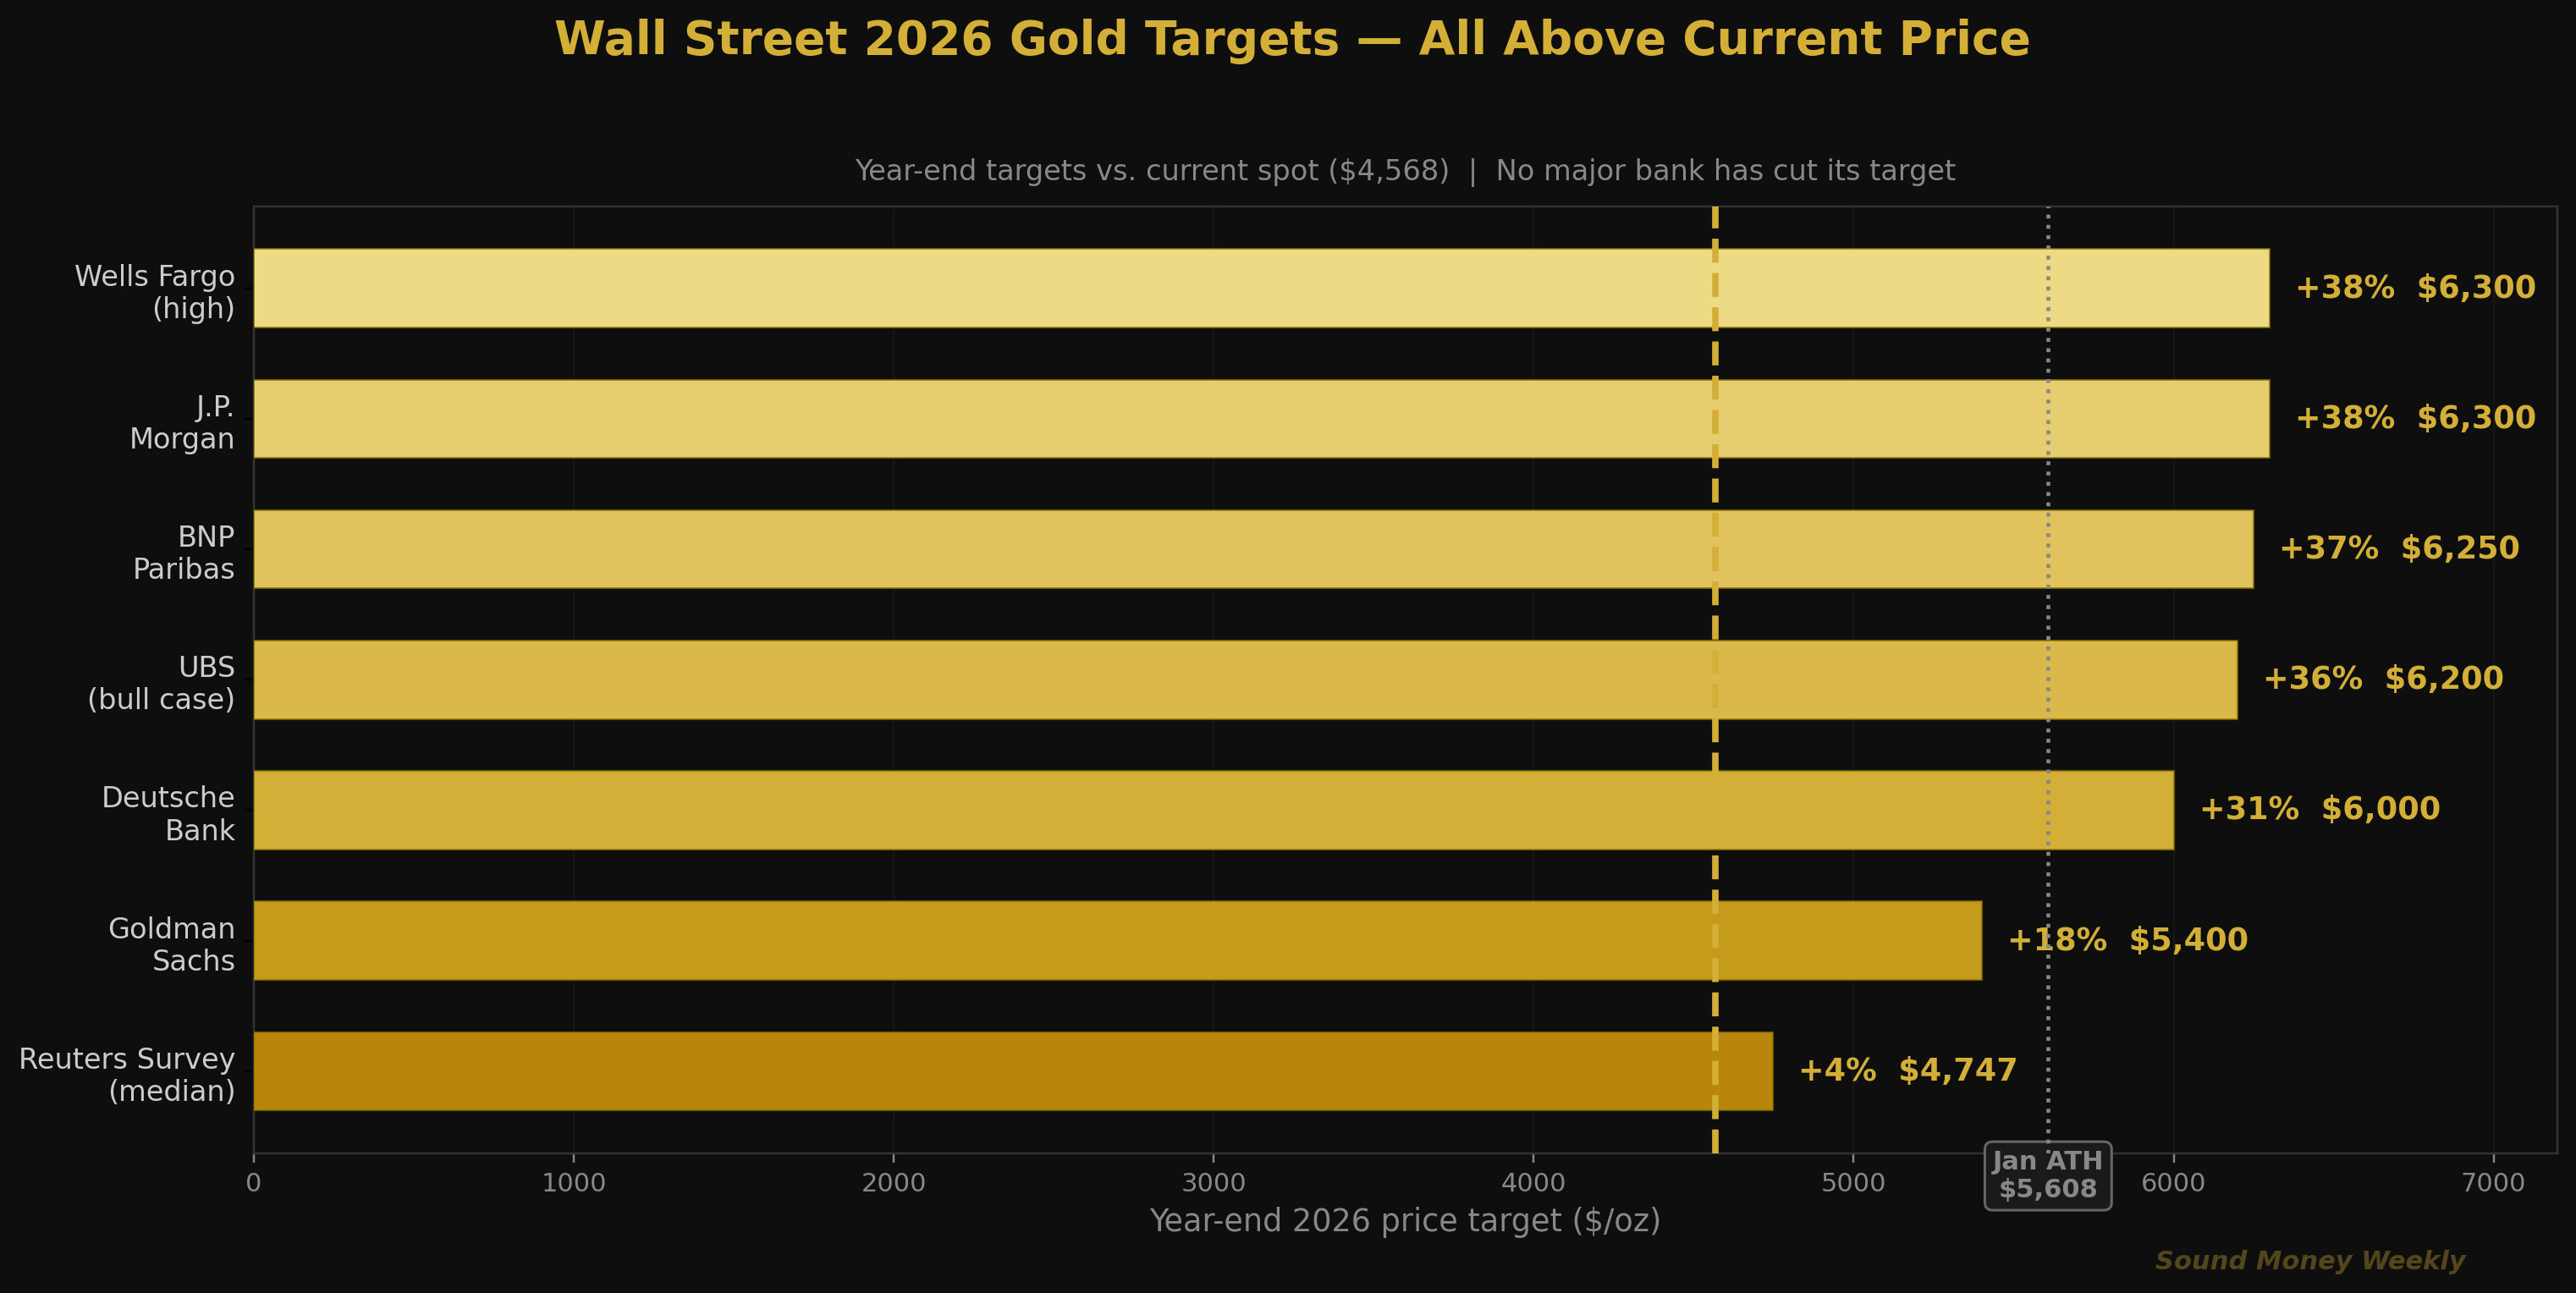
Here's the chart that tells the story: not a single major bank has cut its year-end gold target since the selloff.
| Institution | Year-End 2026 Target | Upside from Current ($4,568) | Status |
|---|---|---|---|
| J.P. Morgan | $6,300/oz | +38% | Maintained |
| Wells Fargo | $6,100–$6,300/oz | +34–38% | Maintained |
| BNP Paribas | >$6,250 peak | +37% | Maintained |
| UBS | $6,200/oz | +36% | Maintained |
| Deutsche Bank | $6,000/oz | +31% | Maintained |
| Goldman Sachs | $5,400/oz | +18% | Reiterated March 25 |
| Reuters Survey (30 analysts) | $4,747 median | +4% | Pre-selloff |
Goldman Sachs reiterated its $5,400 target on March 25, with co-head of commodities research Daan Struyven stating the firm views the decline as consistent with their existing pricing framework, not a structural change. J.P. Morgan's Natasha Kaneva maintains that the long-term diversification trend "has further to run."
The lone dissenter: Ed Yardeni, who told CNN Business he is "considering lowering our year-end target back to $5,000 if gold continues to defy our expectations."
Silver: Still in Deficit, Still Volatile
Silver fell harder than gold — roughly 16% for the worst week versus gold's 11% — consistent with its higher volatility and dual industrial/monetary identity. The gold-to-silver ratio widened from approximately 59:1 pre-war to 65–66:1 at the worst of the selloff, before compressing back to roughly 63:1 today as silver outperformed on the bounce.
The structural picture hasn't changed. The Silver Institute still projects a 67 million ounce deficit in 2026 — the sixth consecutive annual shortfall. COMEX registered silver — the physical metal available for futures delivery — stands at just 76.55 million ounces, down roughly 75% from its 2020 peak. Physical silver deliveries in 2025 totaled 474 million ounces — more than double 2024's pace.
The headwind to watch: the solar industry is accelerating copper substitution after silver's 147% rally in 2025 made silver paste 30% of total solar cell costs. But even with that thrifting factored in, the deficit persists.
What It Means
Here's the plain-English version.
Gold sold off because of oil, not because the thesis broke. The Iran conflict sent Brent crude from $68 to $112 in a month. That shock rewired inflation expectations, killed rate cut hopes, strengthened the dollar, and triggered forced selling from leveraged and algorithmic traders. Every one of those forces is directly tied to the conflict — and every one reverses if the conflict de-escalates.
The structural drivers are intact. Central banks have been net gold buyers for 17 consecutive years. The PBOC has bought gold for 16 straight months. Silver's supply deficit is entering its sixth year. US national debt sits at $38.5 trillion with no fiscal discipline in sight. None of that changed last week.
Every major bank still targets higher. From Goldman's $5,400 to J.P. Morgan's $6,300, the institutional consensus is that gold ends 2026 well above where it trades today. Not one major bank has cut its target.
For dollar cost averagers, the math just improved. At $4,568, a $200 monthly purchase buys about 5.4% more gold than it did at last week's $4,900 level. Over a year, that translates to roughly an extra quarter-ounce of accumulated metal on the same budget. Gold has delivered a 10.9% annualized return since 2000, totaling 1,075%, and has never produced a negative return over any rolling 20-year period since 1971. Corrections like this one are the mechanism that makes DCA work — they're when each purchase stretches furthest.
The key risk is the Fed. If the Iran conflict drags on, oil stays high, inflation re-accelerates, and the Fed hikes, we could be looking at a 2013-style multi-year consolidation rather than a 2020-style V-shaped recovery. That's the honest assessment. The April 9 ceasefire target date and March CPI data (April 10) are the next two inflection points.
This is not a recommendation. We lay out the data, hear both sides, and tell you what we think. We think this selloff is a stress test of the bull market, not the end of it. We also think reasonable people can disagree — the range of outcomes from here is unusually wide, and anyone who tells you they know exactly what happens next is selling you something.
What We're Watching
The Iran ceasefire timeline. The US reportedly set April 9 as its target date for a deal. Iran has rejected the 15-point US proposal as "excessive," but diplomatic channels are open. A ceasefire would crash oil toward $85, revive rate cut expectations, and likely send gold sharply higher. Escalation — particularly if Saudi Arabia and the UAE are drawn deeper in — pushes the opposite direction.
March CPI (April 10). The single most important data point for Fed policy. A hot print entrenches "higher for longer" and pressures gold. A cooling print reopens the rate cut door.
FOMC Minutes (April 8). The full minutes from last week's meeting will reveal how seriously the Fed discussed rate hikes versus holds. The dot plot showed a median of one cut in 2026 — down from two in December.
The $4,200 line. The 200-day moving average sits at roughly $4,150–$4,200. As long as gold holds above that level, the long-term bull market structure is intact. A sustained break below puts the 2013 scenario on the table.
Central bank buying data. January global purchases came in at just 5 tonnes — a sharp deceleration from 2025's pace. Whether central banks used the selloff to add (as the PBOC historically has) or sold to raise capital (as some Gulf states reportedly did) will reshape the medium-term picture.
Until Next Week
The last time gold fell this hard in a single week was 1983 — when OPEC nations liquidated reserves after an oil revenue collapse. History is rhyming: a Middle East conflict is again the trigger, though the mechanism runs through inflation expectations and rate pricing rather than petrodollar liquidation.
GoldSilver analyst Alan Hibbard pointed to the 2020 parallel: "The real question isn't why gold fell. It's what happens after the forced selling ends." In March 2020, gold dropped 17% in weeks. Five months later, it hit a new all-time high.
We don't know which historical pattern this follows. We do know that the structural forces — central bank accumulation, fiscal deficits, silver supply shortages, and de-dollarization — haven't resolved. They've been temporarily overshadowed by an oil shock. Temporary shocks produce temporary corrections. Structural trends produce structural moves.
We'll be here every week, tracking the data and telling you what we actually think. See you Monday.
Sound Money offers fractional gold and silver ownership at whole-ounce pricing — no minimums, no premiums. Learn more at sound.money.
Disclaimer: This content is provided by Sound Money for educational and informational purposes only. Nothing published here constitutes investment advice, financial advice, trading advice, or any other form of professional advice. Sound Money is not a registered investment advisor, broker-dealer, or financial planner. The information presented reflects our analysis of publicly available data and should not be relied upon as a basis for investment decisions. Precious metals investments carry risk, including the potential loss of principal. Past performance does not guarantee future results. Always consult a qualified financial advisor before making investment decisions. For more information about Sound Money's products and services, visit sound.money.
- gold
- silver
- precious-metals
- inflation
- fed
- markets
- weekly-update