Gold Fell to a Two-Month Low, Then Rebounded. Here's Who Was Buying.
Gold hit $4,066, then closed the week up 1.3%. ETFs added 70+ tonnes in September and China bought 21. September CPI lands Wednesday.
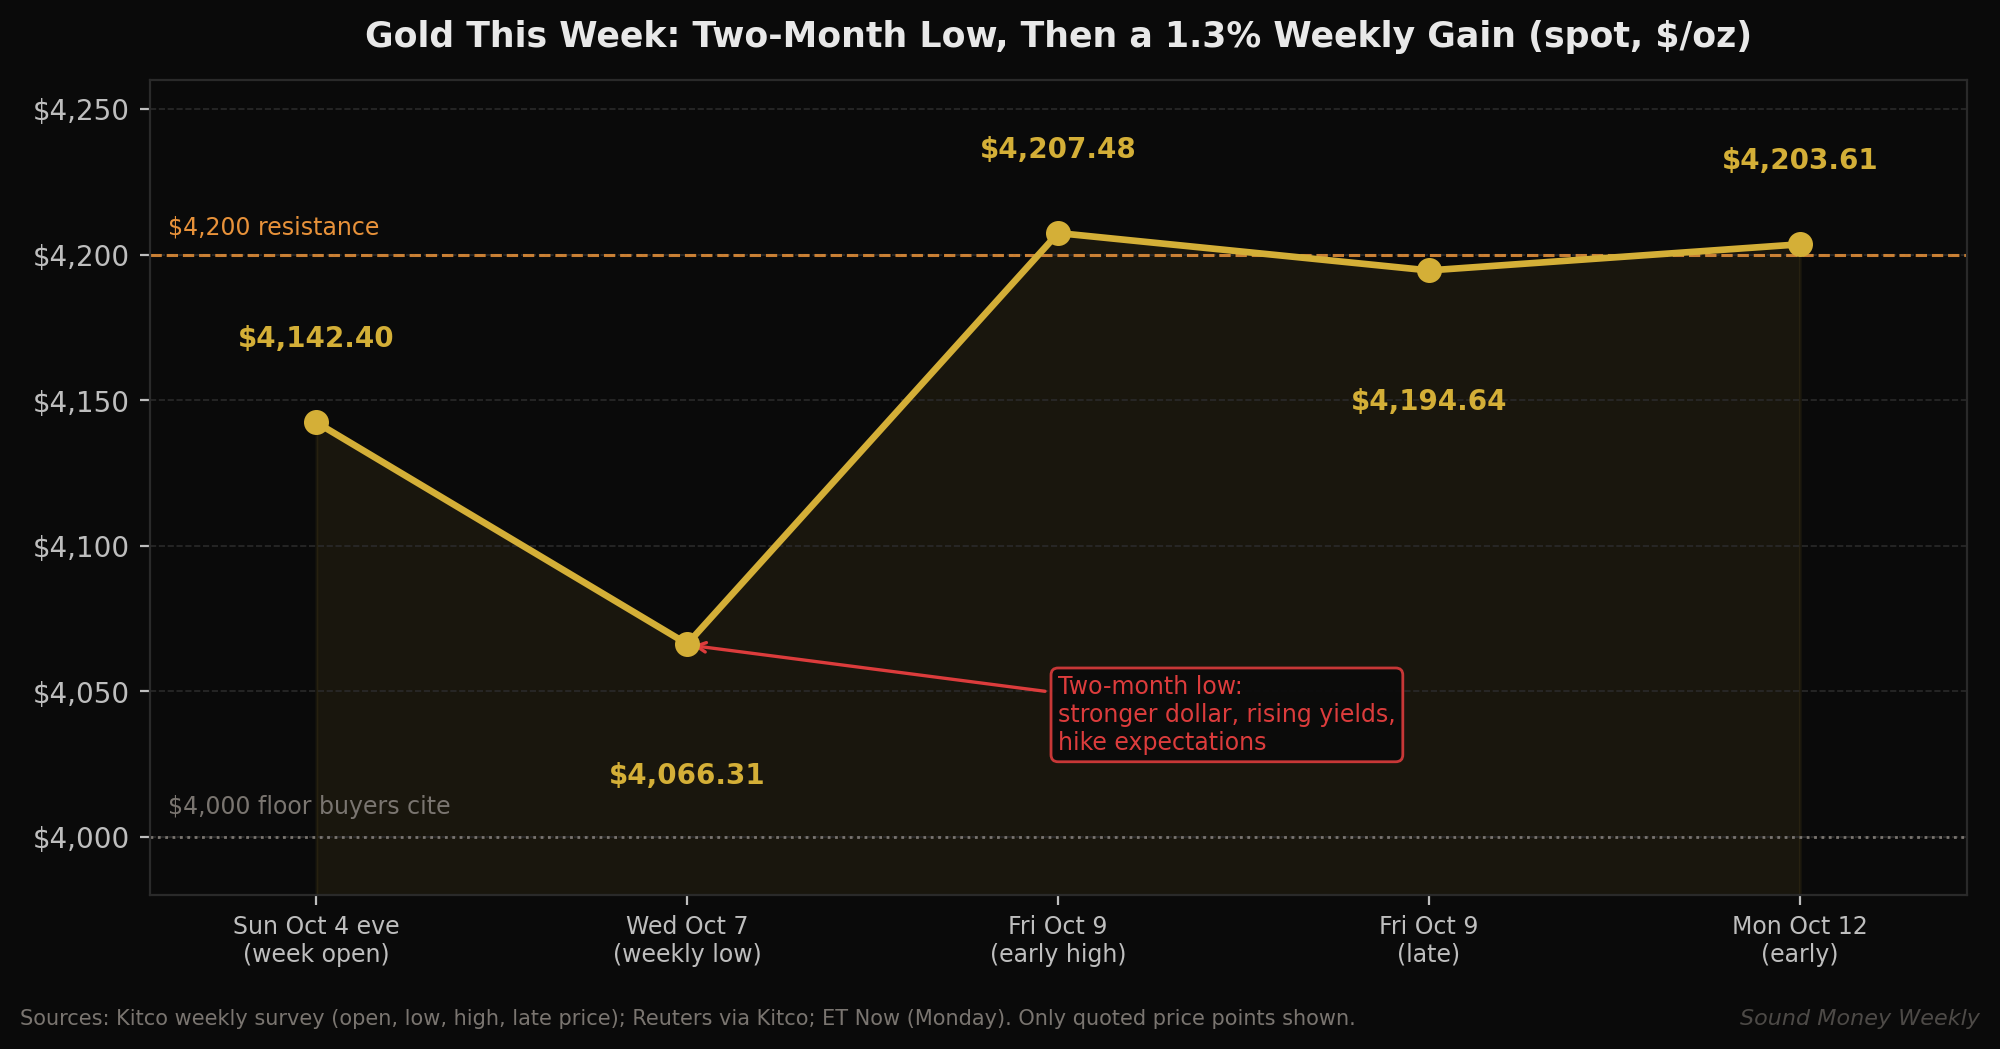
Gold had a week that looked, from a distance, like a shrug. It opened Sunday evening at $4,142.40, sank to a weekly low of $4,066.31 on Wednesday, and finished near $4,195, up about 1.3% on the week.
Underneath that shrug was a rough ride. Wednesday's low was a two-month low, driven by a stronger dollar and rising Treasury yields. Then buyers stepped in, and Friday became gold's strongest session of the week. Early this morning gold is trading just above $4,200, with silver above $61.
The more interesting question than "where is the price?" is "who is buying while it dips, and who is selling?" The data that came out this week answers that more clearly than any chart.
How the Week Unfolded
According to Kitco's weekly recap, the rally stalled Tuesday as the dollar and Treasury yields strengthened, and selling accelerated Wednesday amid rate-hike expectations. Thursday brought a recovery after a strong 30-year Treasury auction helped pull yields back. Friday was the week's strongest move, as the dollar softened, yields eased, oil pulled back, and reports of productive U.S.-Iran talks and dip-buying near $4,100 supported the rebound.
Reuters reported that spot gold rose 1.5% to $4,194.36 on Friday, touching a one-week high, and that US 10-year yields were off the over-two-decade highs they had hit on Wednesday. The 10-year ended the week at 5.243%. Silver gained 2.4% on Friday to $60.77.
The Fed's own paper trail explains why yields were so jumpy. The minutes of the September 15-16 meeting, released Wednesday, said "most participants assessed that another increase in the target range for the federal funds rate would likely be appropriate by year end." They also said participants "had not seen sufficient progress on lowering inflation in recent months," and that almost all saw inflation risks tilted to the upside while labor-market risks had become broadly balanced. On Thursday, St. Louis Fed President Alberto Musalem said the Fed would need to hike again to bring inflation back to 2%. As of Friday, CME's FedWatch put the odds of an October hike at 19%, and the odds of at least one hike by December at 84%.
In plain English: the market already expects one more hike this year. Gold's weekly swings were the market re-weighing how likely, and how soon, rather than discovering anything new.
Who Was Buying the Dip
Funds kept adding metal
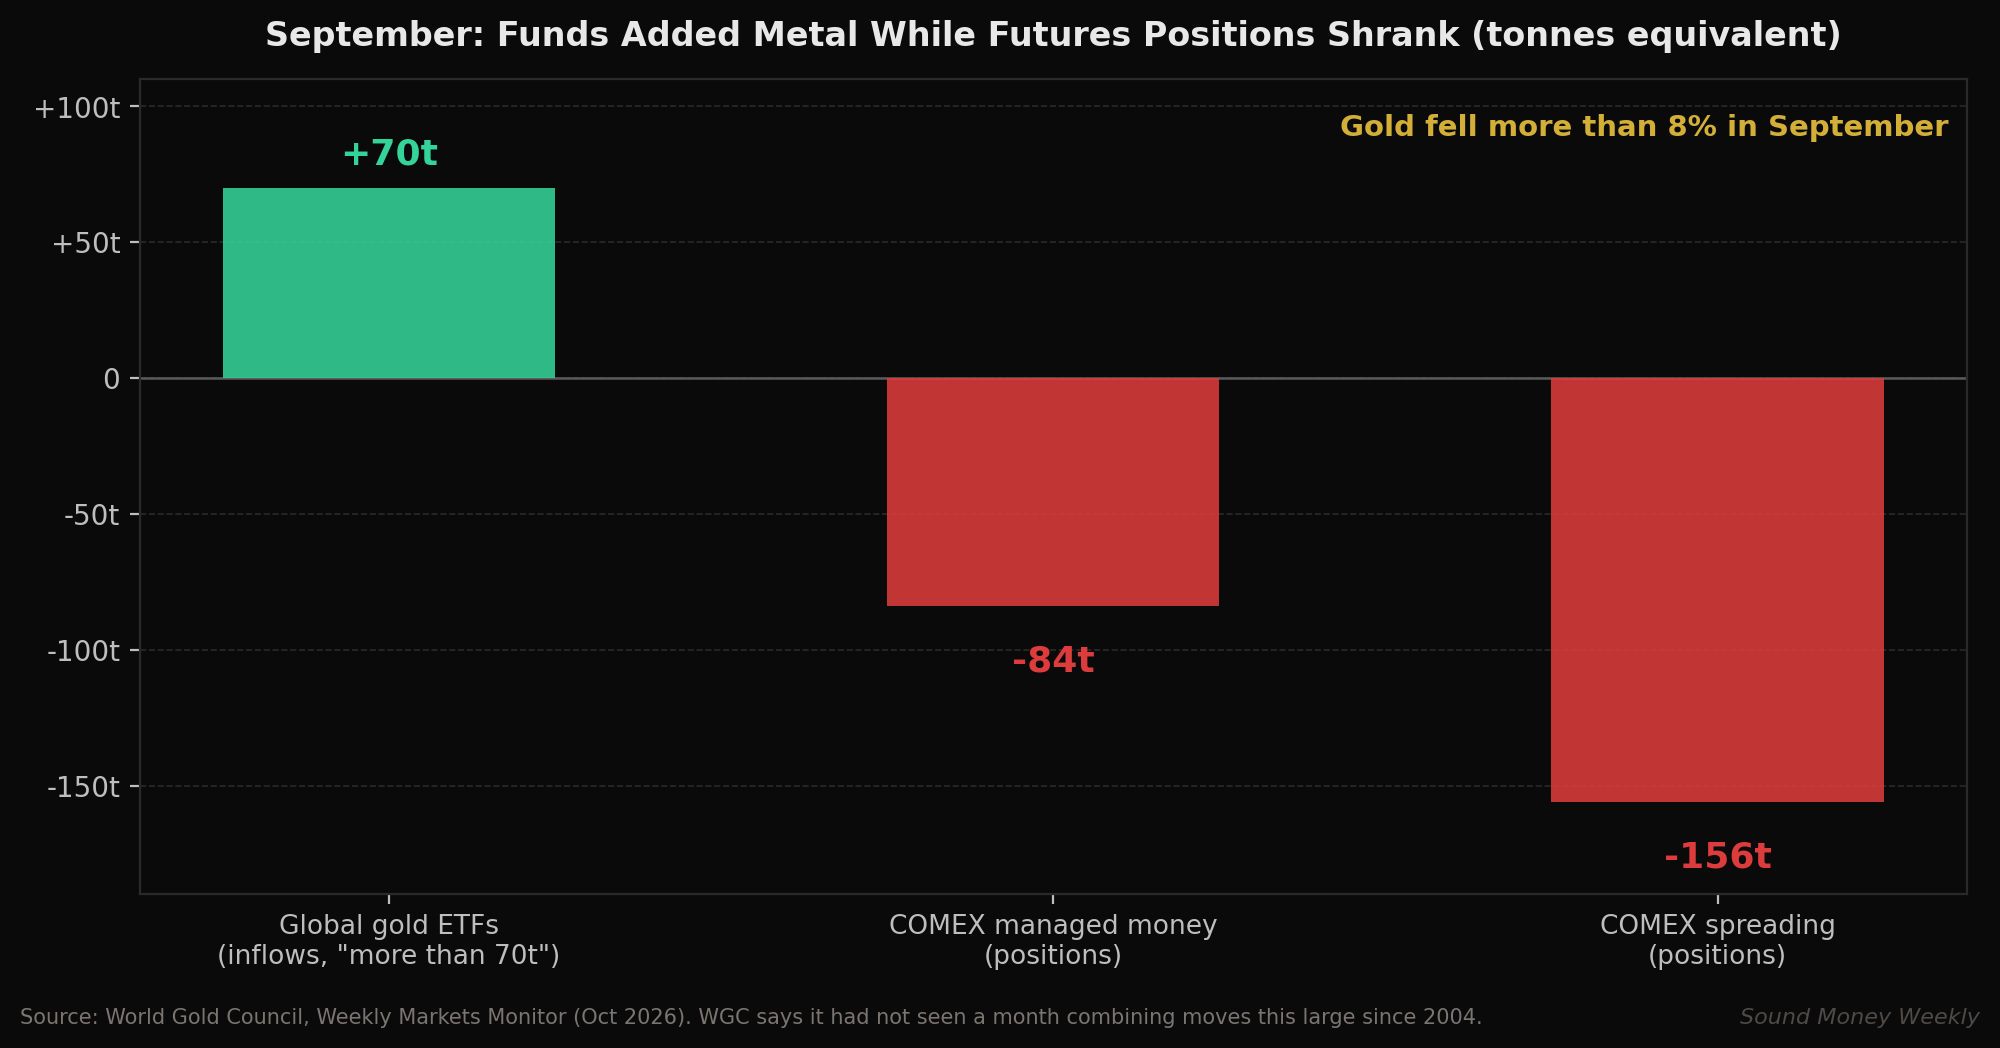
The World Gold Council reported that gold fell more than 8% in September while global gold ETFs added more than 70 tonnes. The WGC said it had not previously observed a month that combined moves of that size in its data going back to January 2004. The same report showed what was on the other side: COMEX managed-money positions fell by 84 tonnes equivalent, and spread positions fell by 156.
So September was not one market. It was two. One group kept adding physical-backed holdings through ETFs. Another group unwound futures bets, and that unwinding helped push the price lower despite the ETF demand.
Central banks kept shopping
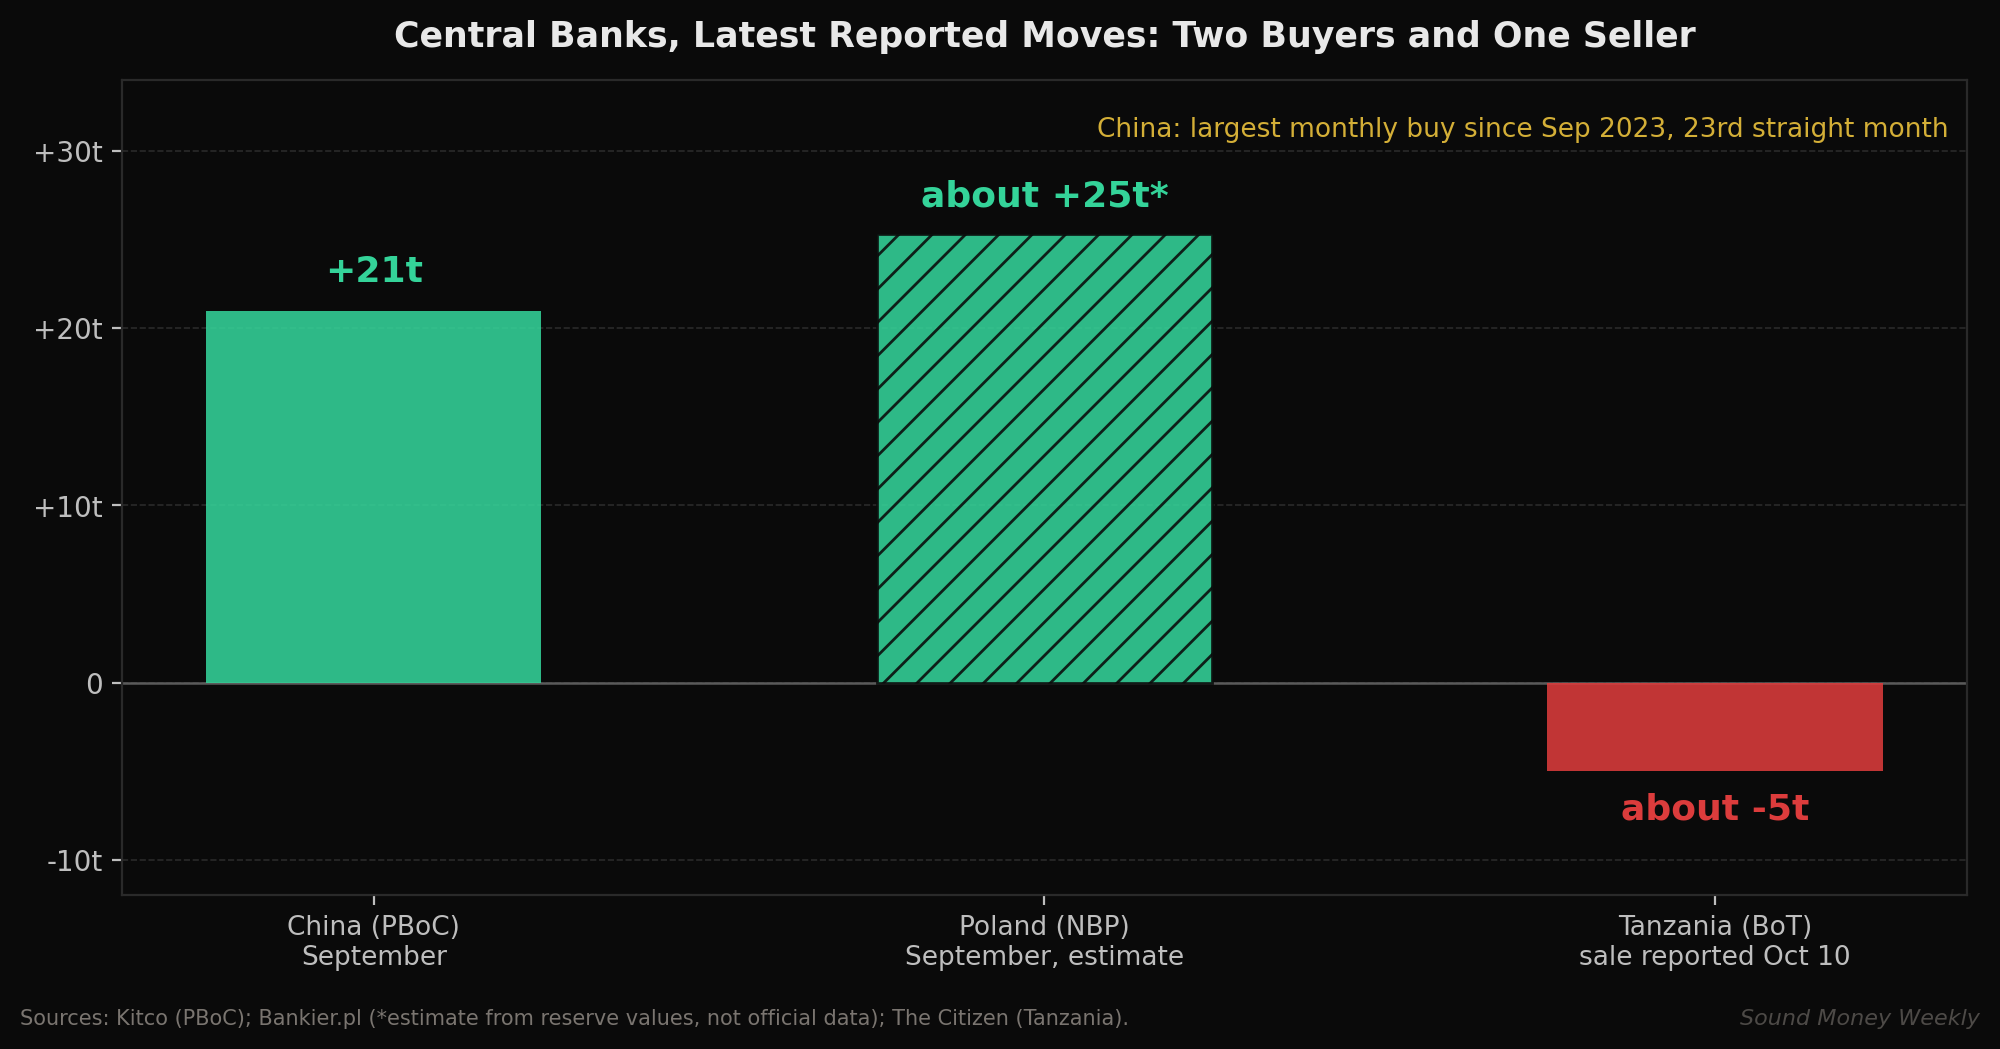
China's central bank added 21 tonnes of gold in September, lifting reserves to 2,196 tonnes. It was the largest monthly increase since September 2023 and the 23rd consecutive month of purchases. Kitco noted China ramped up purchases as bullion prices declined. The World Gold Council's Marissa Salim wrote that global central banks reported net purchases of 39 tonnes in August and 170 tonnes through August, with Poland leading year to date at 98 tonnes and China second at 80.
Poland kept going too. Governor Adam Glapiński said NBP held nearly 673 tonnes at the end of September, versus more than 648 tonnes at the end of August, and described the bank as "very close" to its 700-tonne target. Bankier.pl estimated September purchases at about 25 tonnes, the largest in 19 months, though it stressed that estimate is not official data.
And one seller took profits
Not everyone was buying. Tanzania's central bank sold about five tonnes of gold at around $4,640 an ounce, leaving roughly 30 tonnes of the 35.4 it had accumulated. Governor Emmanuel Tutuba said the bank's analysts judged prices favorable and sold, then stopped when prices later declined.
That is a useful reality check. Central banks are not a single bloc moving in lockstep. Some reserve managers treat gold as a position to trim when the price is attractive. What stands out is how lopsided the picture still is: two of the world's most consistent buyers added roughly 46 tonnes between them in a single month (counting Bankier's unofficial Poland estimate), against a five-tonne sale.
The Skeptic's Case
Balance matters here, so consider the cautious reading. StoneX analyst Rhona O'Connell told Reuters: "It is arguable that a further Fed hike is already priced in but so is the expectation for continued official sector net purchases. Without any Black Swan event I find it hard to see gold breaking convincingly higher." In other words, the buyers described above may already be in the price.
HSBC trimmed its gold forecasts on October 1, to an average of $4,490 an ounce for 2026 and $4,825 for 2027. It also said gold could face more near-term pressure but was likely nearing a bottom, and expected central banks to resume buying in response to price declines, especially near or below $4,000.
Sentiment is split. In Kitco's weekly survey, 7 of 14 Wall Street analysts (50%) were bullish and 2 bearish, while 45% of 206 Main Street voters were bullish and 37% bearish.
Technical Levels, Translated
- $4,200 is the ceiling gold keeps bumping into. It touched $4,207.48 early Friday and has hovered around it since.
- $4,000 is the floor buyers keep citing. O'Connell said buying at the lows reflected "a floor ... building in the $4,000-region." Bybit's Han Tan warned that stubborn inflation could force a retest of $4,000.
What it means: gold is range-bound. A close above $4,200 would be notable, and a drop below $4,000 would test the buyers described above. For someone who accumulates on a schedule, neither level changes the plan.
What This Means for the DCA Investor
Weeks like this one are why a schedule beats a guess. If you had picked one day to buy, you could have paid anywhere from $4,066 to $4,207. A monthly plan simply buys whatever the price is and moves on.
The math at about $4,200:
- $200 a month buys about 0.0476 oz of gold, roughly 33.5% more metal per dollar than at January's $5,608 all-time high.
- Twelve months of $200 contributions ($2,400 total) adds up to about 0.571 oz at today's price.
- If gold simply revisits August 25's $4,607 intraday high (per StoneX), that 0.571 oz would be worth about $2,633, a gain of roughly 9.7% on contributions.
- A contribution made at Wednesday's $4,066.31 low would have bought about 0.0492 oz, roughly 3.3% more than the same $200 at $4,200.
- For silver at about $61, $200 a month buys about 3.28 oz.
That is arithmetic, not a forecast. The point is that a steady buyer collects more ounces when the price dips and never needs to identify the low. At Sound Money, fractional buyers pay whole-ounce pricing on small amounts rather than the heavy premiums that typically come with small physical purchases, which is what makes a monthly plan practical.
What We're Watching
- September CPI on Wednesday, October 14. Consensus calls for headline inflation to rise to around 3.7% year over year (+0.6% on the month), driven by an energy jump, with core steady near 2.4% (+0.2% on the month), per InvestingLive's preview. It is the last inflation report before the Fed's October 27-28 meeting. A firm core reading could revive October hike bets, while a soft one would reinforce expectations for December.
- The October 27-28 FOMC meeting. Odds of a hike are about 18%, per CME FedWatch, with the 10-year yield at about 5.23% this morning.
- Poland's 700-tonne target. NBP says it is very close. Whether it stops there or sets a new goal will say a lot about how long central-bank demand lasts.
- China's October reserve data. A 24th straight month would extend the streak.
- ETF flows versus futures positioning. September's split was unusual. Whether it closes by ETFs slowing or futures rebuilding is worth tracking.
The Bottom Line
Gold fell to a two-month low, rebounded to a 1.3% weekly gain, and spent the week caught between a Fed that expects another hike and buyers who treat dips as opportunities. September's data showed ETFs adding more than 70 tonnes during an 8% decline, China posting its biggest monthly purchase in three years, and Poland edging toward its 700-tonne goal. One small central bank sold. The balance of the evidence still points to patient accumulation on one side of the ledger.
You do not have to predict who wins the next round. A consistent monthly purchase takes the dip as it comes, and lower prices simply mean more ounces for the same dollars.
This article is for informational purposes only and does not constitute investment advice. Past performance of gold and silver prices is not indicative of future results. Always conduct your own research and consult a qualified financial advisor before making investment decisions. Sound Money provides fractional precious metals ownership services — see sound.money for full terms and conditions.
- gold
- silver
- precious-metals
- central-banks
- gold-etfs
- federal-reserve
- cpi
- dollar-cost-averaging