When Gold Rallies on Good News: The Iran Signal and Silver's Wild Week
The Iran deal is near and gold is up on the news. US-China truce compressed silver's GSR to 55:1. Here's what the summer setup looks like for stackers.
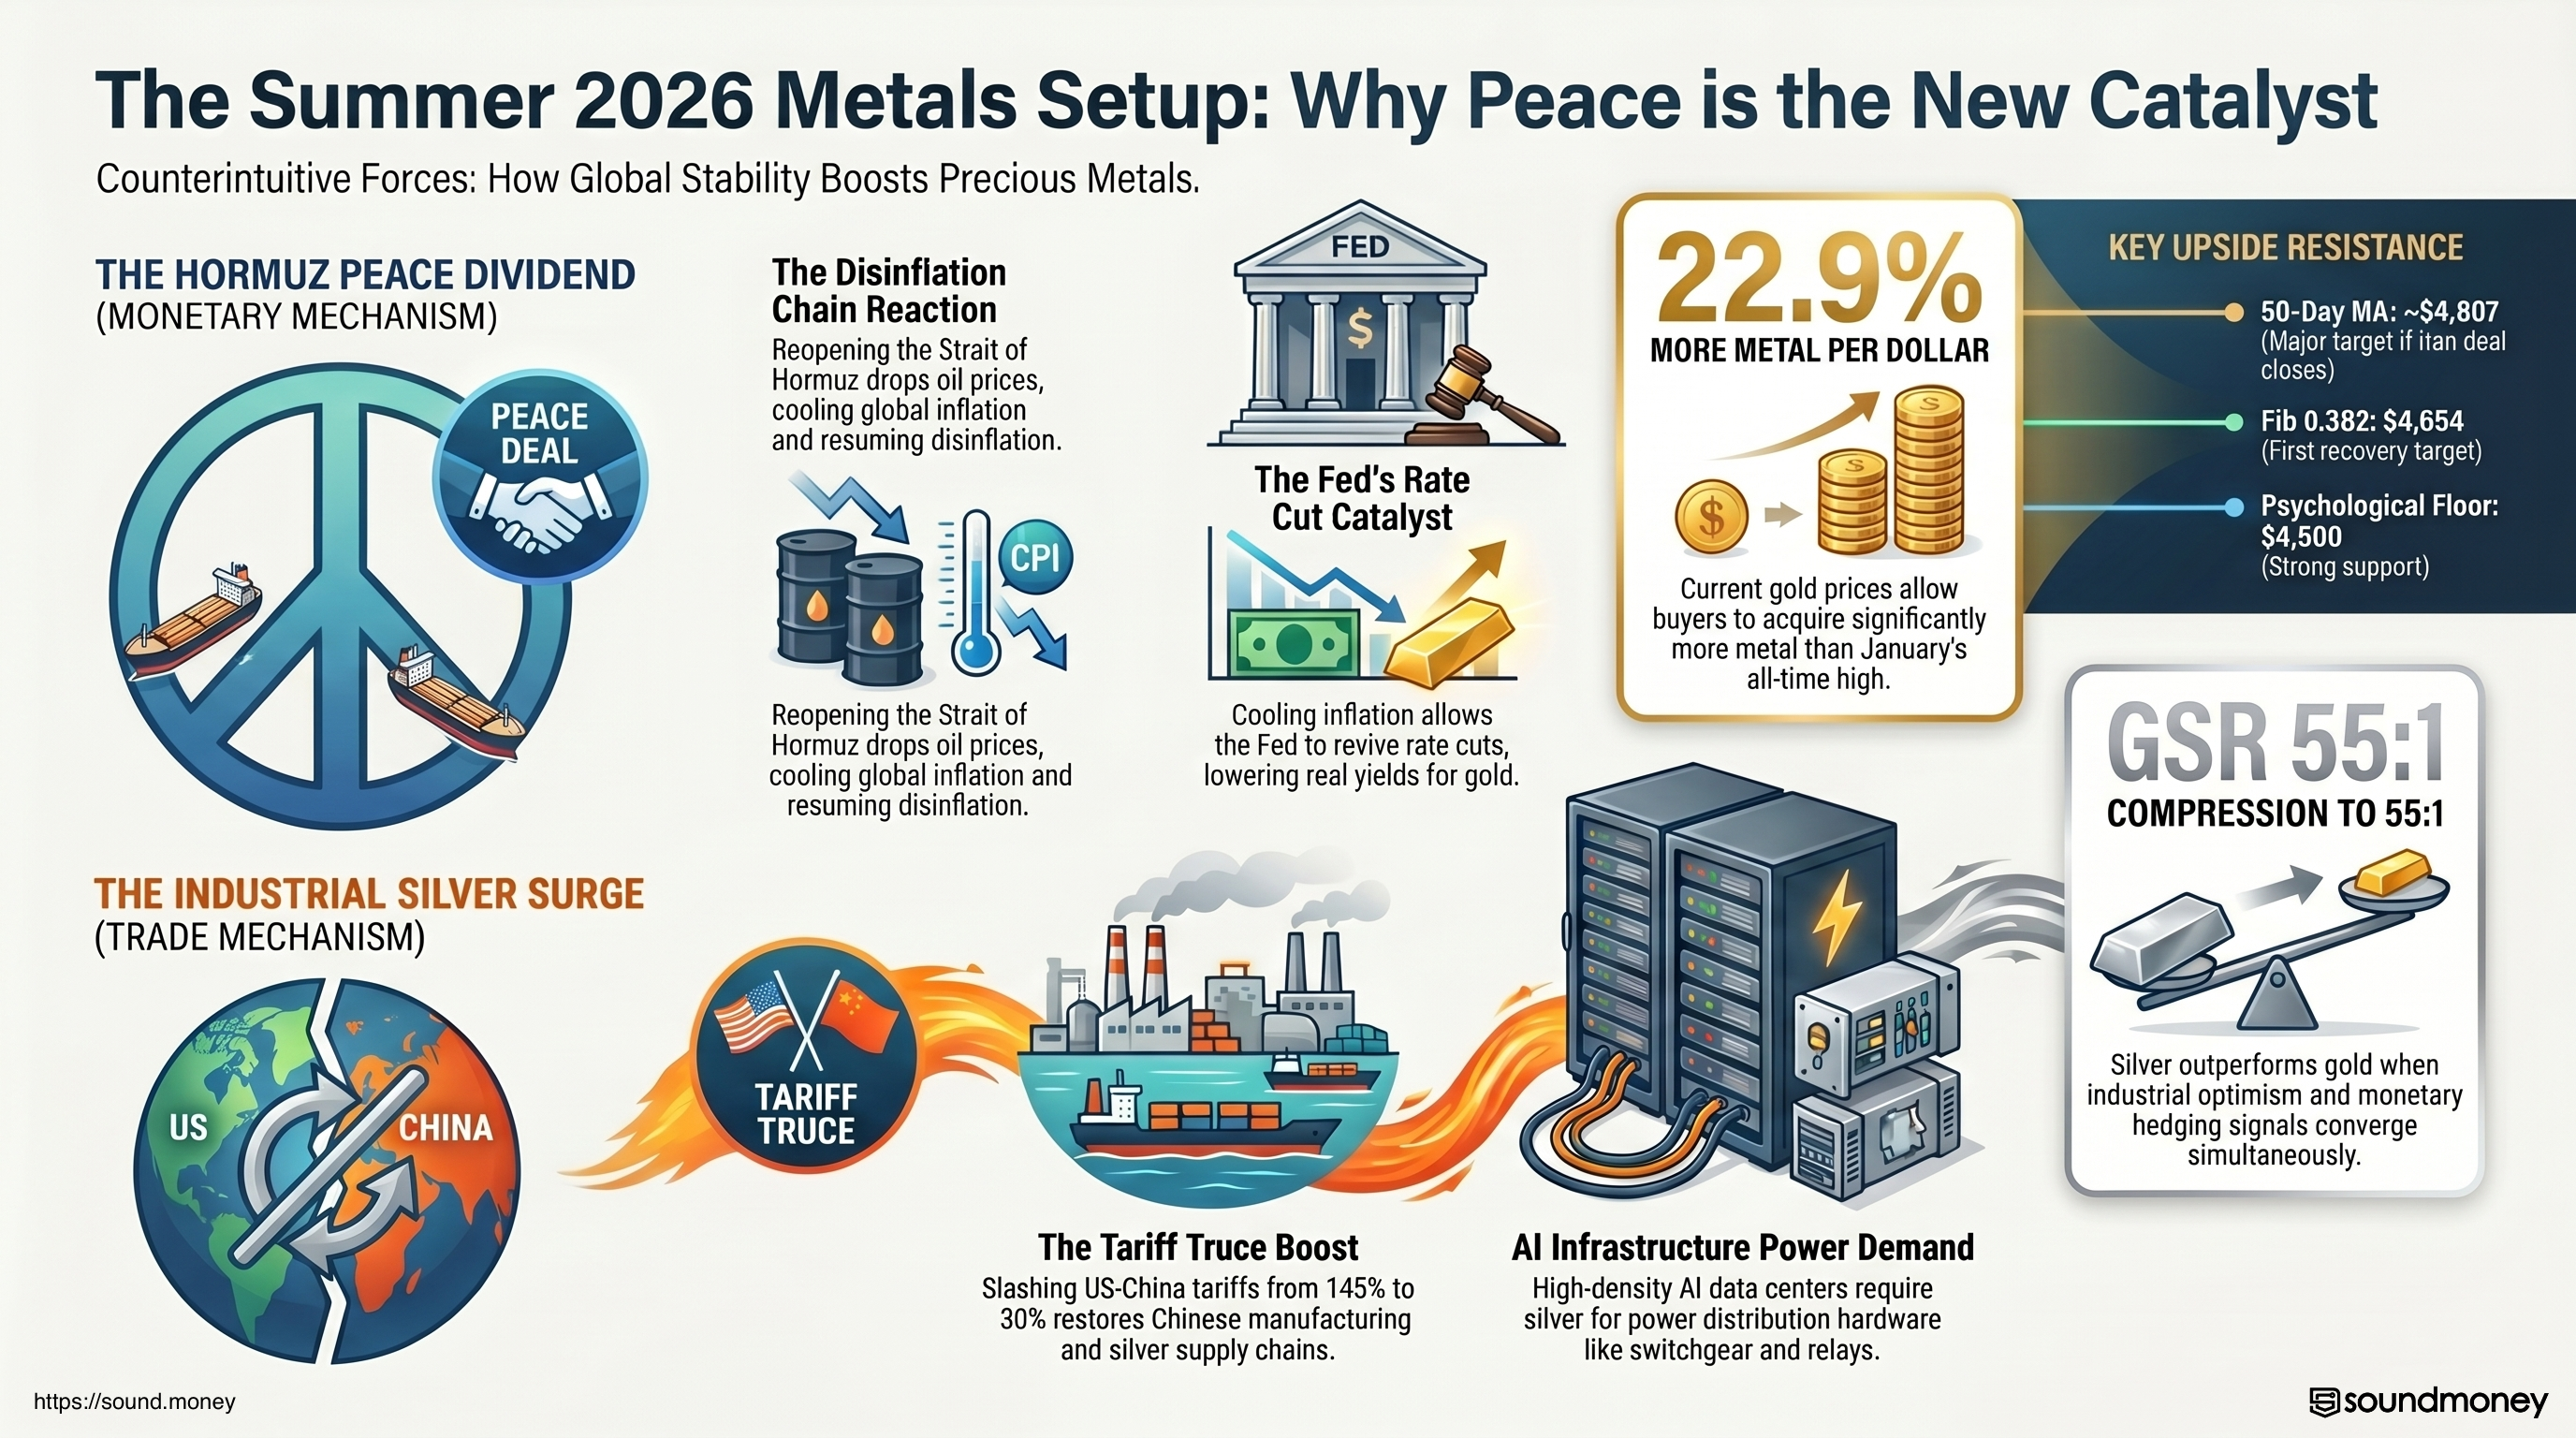
Gold is rallying this morning not because the world is getting worse. It is rallying because the world might be getting better. That distinction matters more than most people realize.
When Gold Rallies on Good News: The Iran Signal and Silver's Wild Week
Sound Money Weekly | May 25, 2026
The Hook
Most people think gold is a crisis hedge. Buy gold when things break. Sell when things stabilize. That framing is not wrong -- but it is incomplete. And this week exposes exactly what it misses.
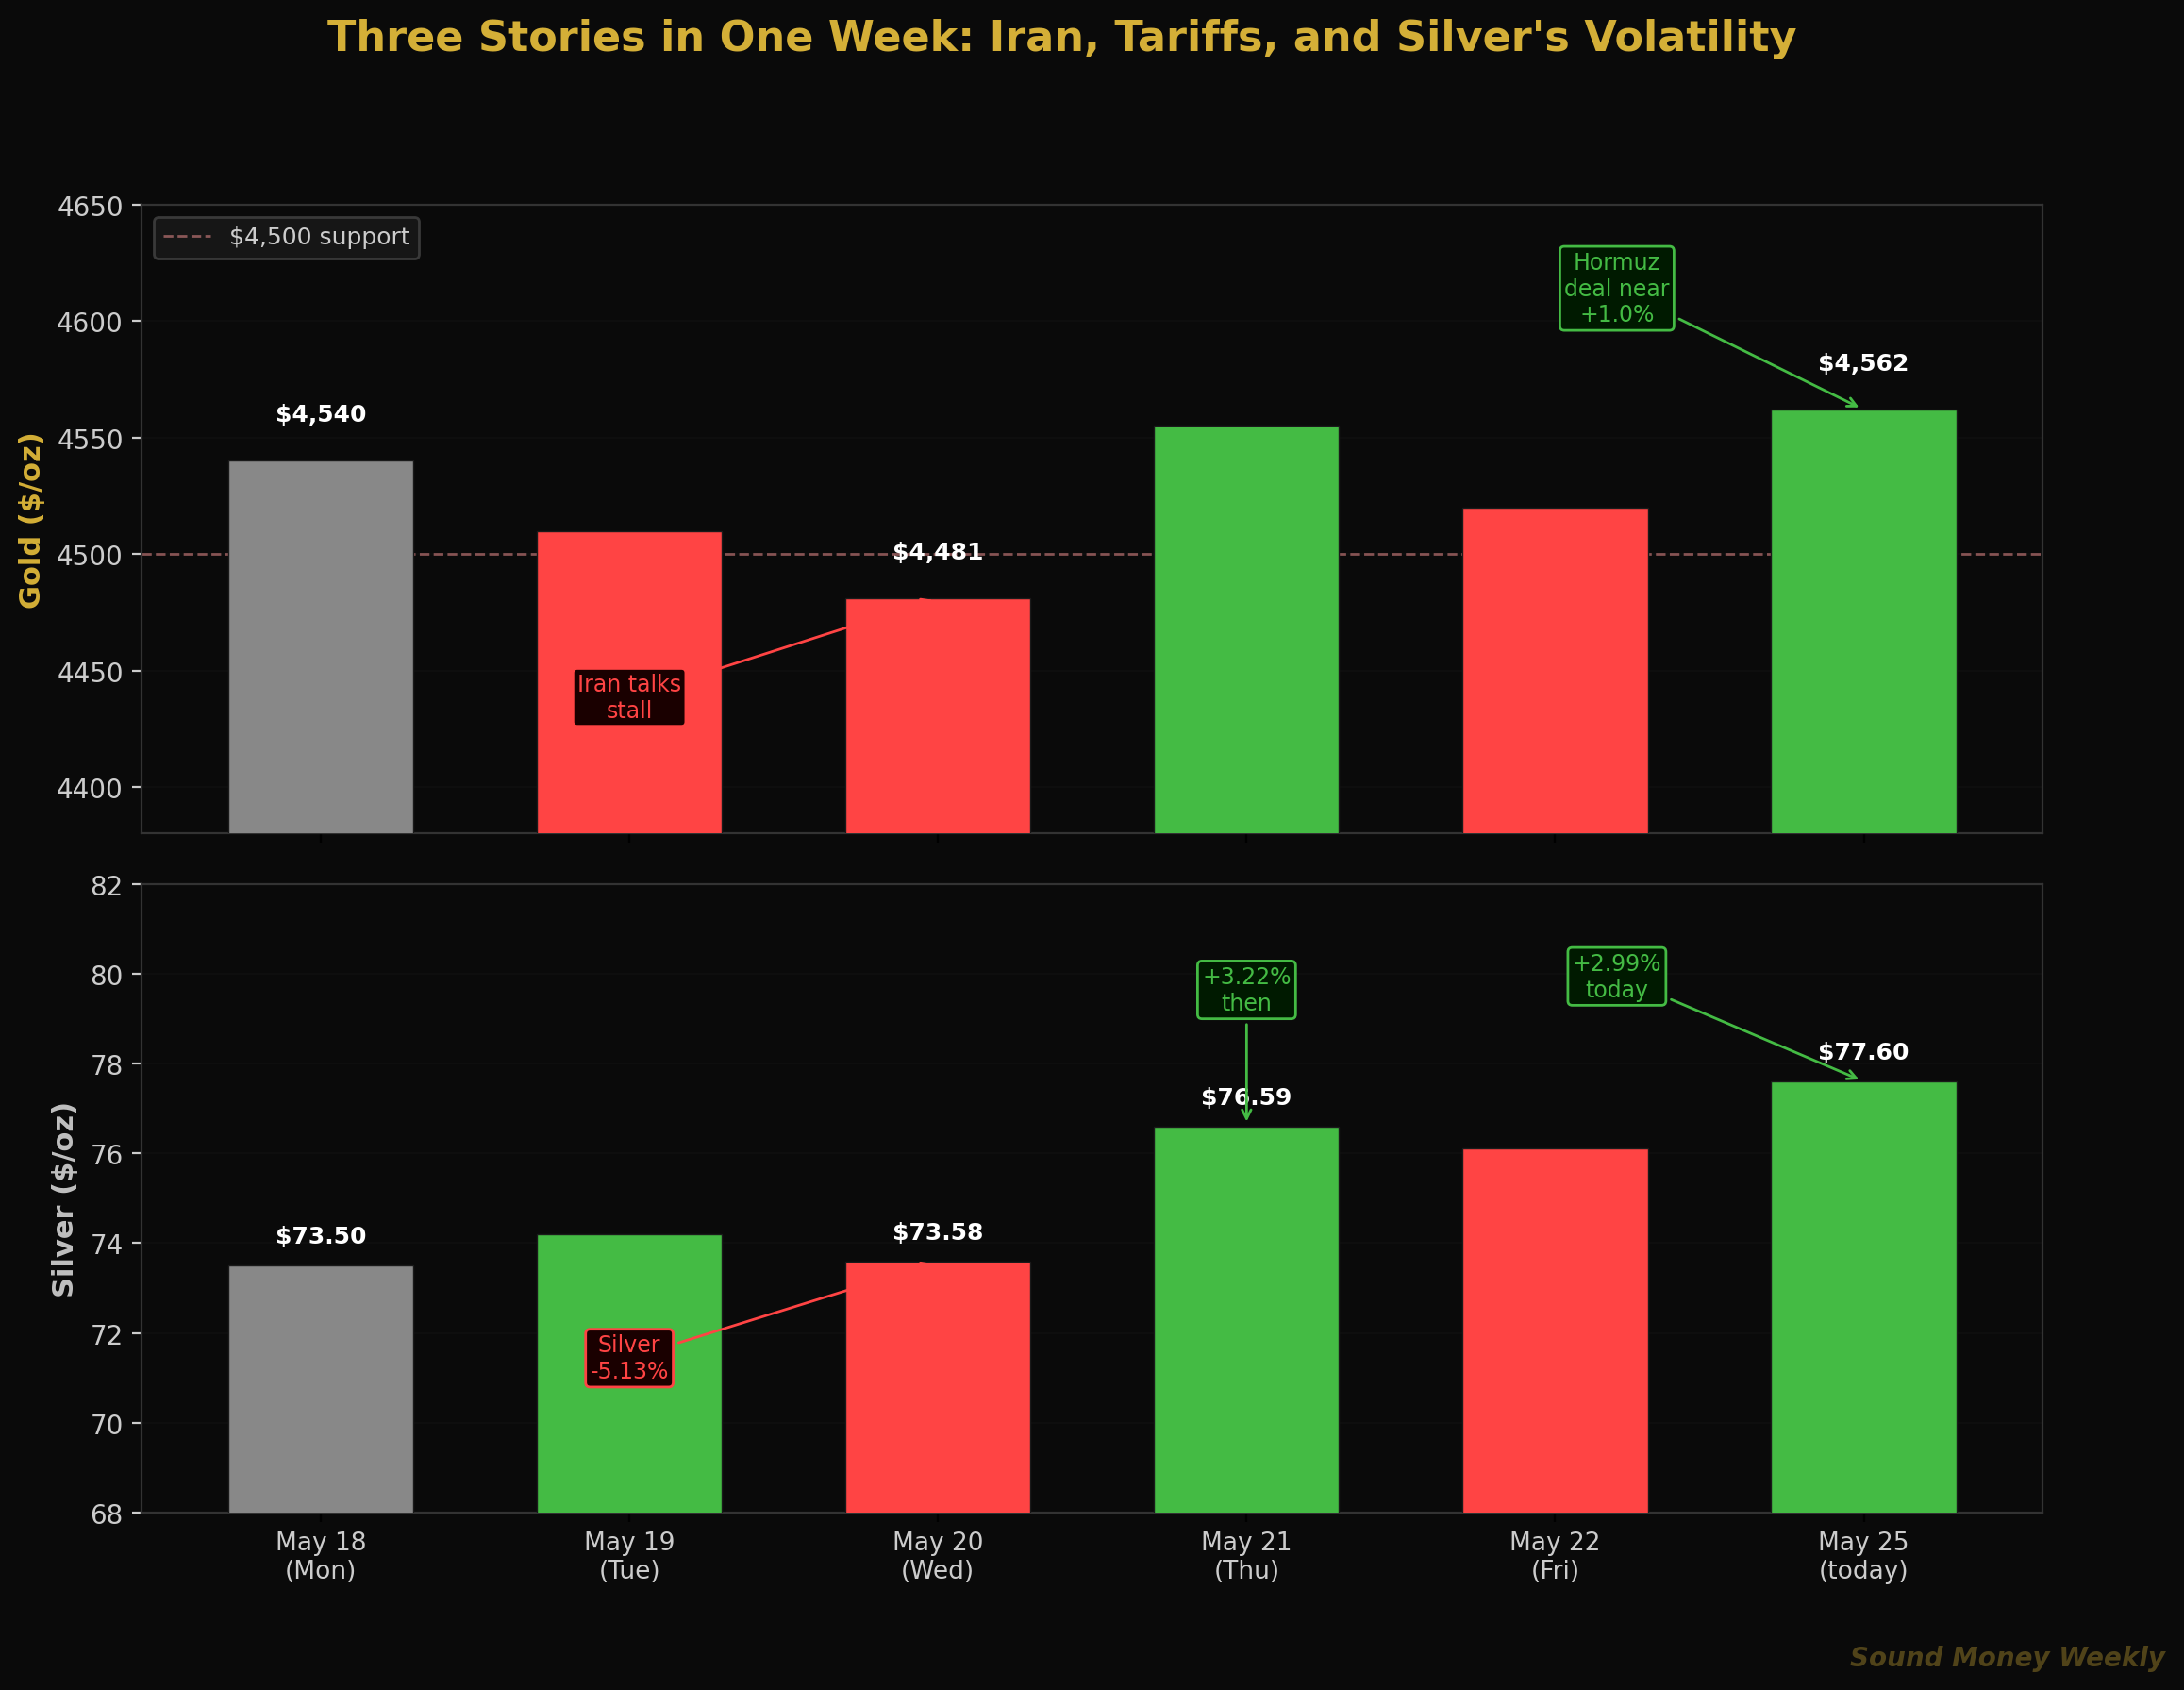
This morning gold is up 1.0% to $4,562. Silver is up 2.99% to $77.60. The catalyst, per Yahoo Finance and Bloomberg coverage: the United States and Iran are reportedly nearing a deal that would include reopening the Strait of Hormuz.
That is emphatically good news. Oil would drop toward $80. Global inflation would ease. The Fed's rate path would soften. Rate cut expectations -- currently at zero for 2026 -- would revive. And when real yields fall and the rate-cut mechanism reopens, gold tends to benefit materially.
The insight most investors miss: gold does not just go up when inflation surges. It also goes up when inflation is expected to ease because easing inflation = lower rates = lower real yields = higher gold. The mechanism runs through the bond market, not through the fear trade. An Iran deal would trigger exactly this: oil drops, disinflation resumes, the Fed reopens the door to cuts, and gold -- which has been held back all year by "higher for longer" -- is suddenly free to run toward the targets that every major bank has maintained through the entire correction.
CNBC analysts put it plainly in May: gold and silver's "historic rally could resume as fog of war lifts." They are not wrong.
This week also featured one of silver's most volatile stretches of 2026: a 5.13% single-session crash, a 3.22% single-session surge, and the gold-to-silver ratio whipsawing from 62:1 to 55:1 and back. The three stories -- Iran, silver, and what it all means for the summer -- are worth untangling.
The Three Stories of the Week
Story 1: The US-China Tariff Truce and Silver's Surge
The first catalyst arrived earlier this month: the United States and China announced a 90-day tariff truce, slashing US tariffs on Chinese goods from 145% to 30% and Chinese tariffs on US goods from ~125% to 10%. The announcement triggered an immediate silver surge -- GoldSilver.com reported silver up 6% in a single session -- compressing the gold-to-silver ratio from approximately 62:1 to 55:1.
The logic is direct: a US-China trade truce means resumed Chinese manufacturing activity, restored industrial supply chains, and growing demand for silver in solar panels, EVs, and electronics. Silver reacted before gold because silver carries the industrial demand signal that gold does not.
Story 2: May 20 -- Silver Breaks Down on Iran Stall
On Wednesday, May 20, the silver rally reversed sharply. Kitco reported spot silver down 5.13% to $73.58, breaking the $74 support level, while gold fell 1.84% to $4,481 as Iran ceasefire talks hit an impasse. The dual-channel nature of silver -- simultaneously a monetary asset and an industrial commodity -- was on full display. When geopolitical risk re-escalated (stalled Iran talks = higher oil = tighter rates = less industrial optimism), silver got sold in both channels simultaneously.
Gold, which only carries the monetary channel, fell 1.84%. Silver, carrying both, fell 5.13%. Nearly three times the move on the same headline.
Story 3: May 21-25 -- Recovery and the Iran Signal
The following day, silver recovered 3.22% to $76.59 as the dollar softened (DXY ~99.12) and 10-year yields eased to 4.59%. Copper rallied alongside metals as Asian stocks surged on renewed Hormuz reopening hopes. Gold gained 1.37% to $4,554. And today, the Iran deal reports have pushed both metals higher again.
The GSR: What Silver's Compression Is Telling You
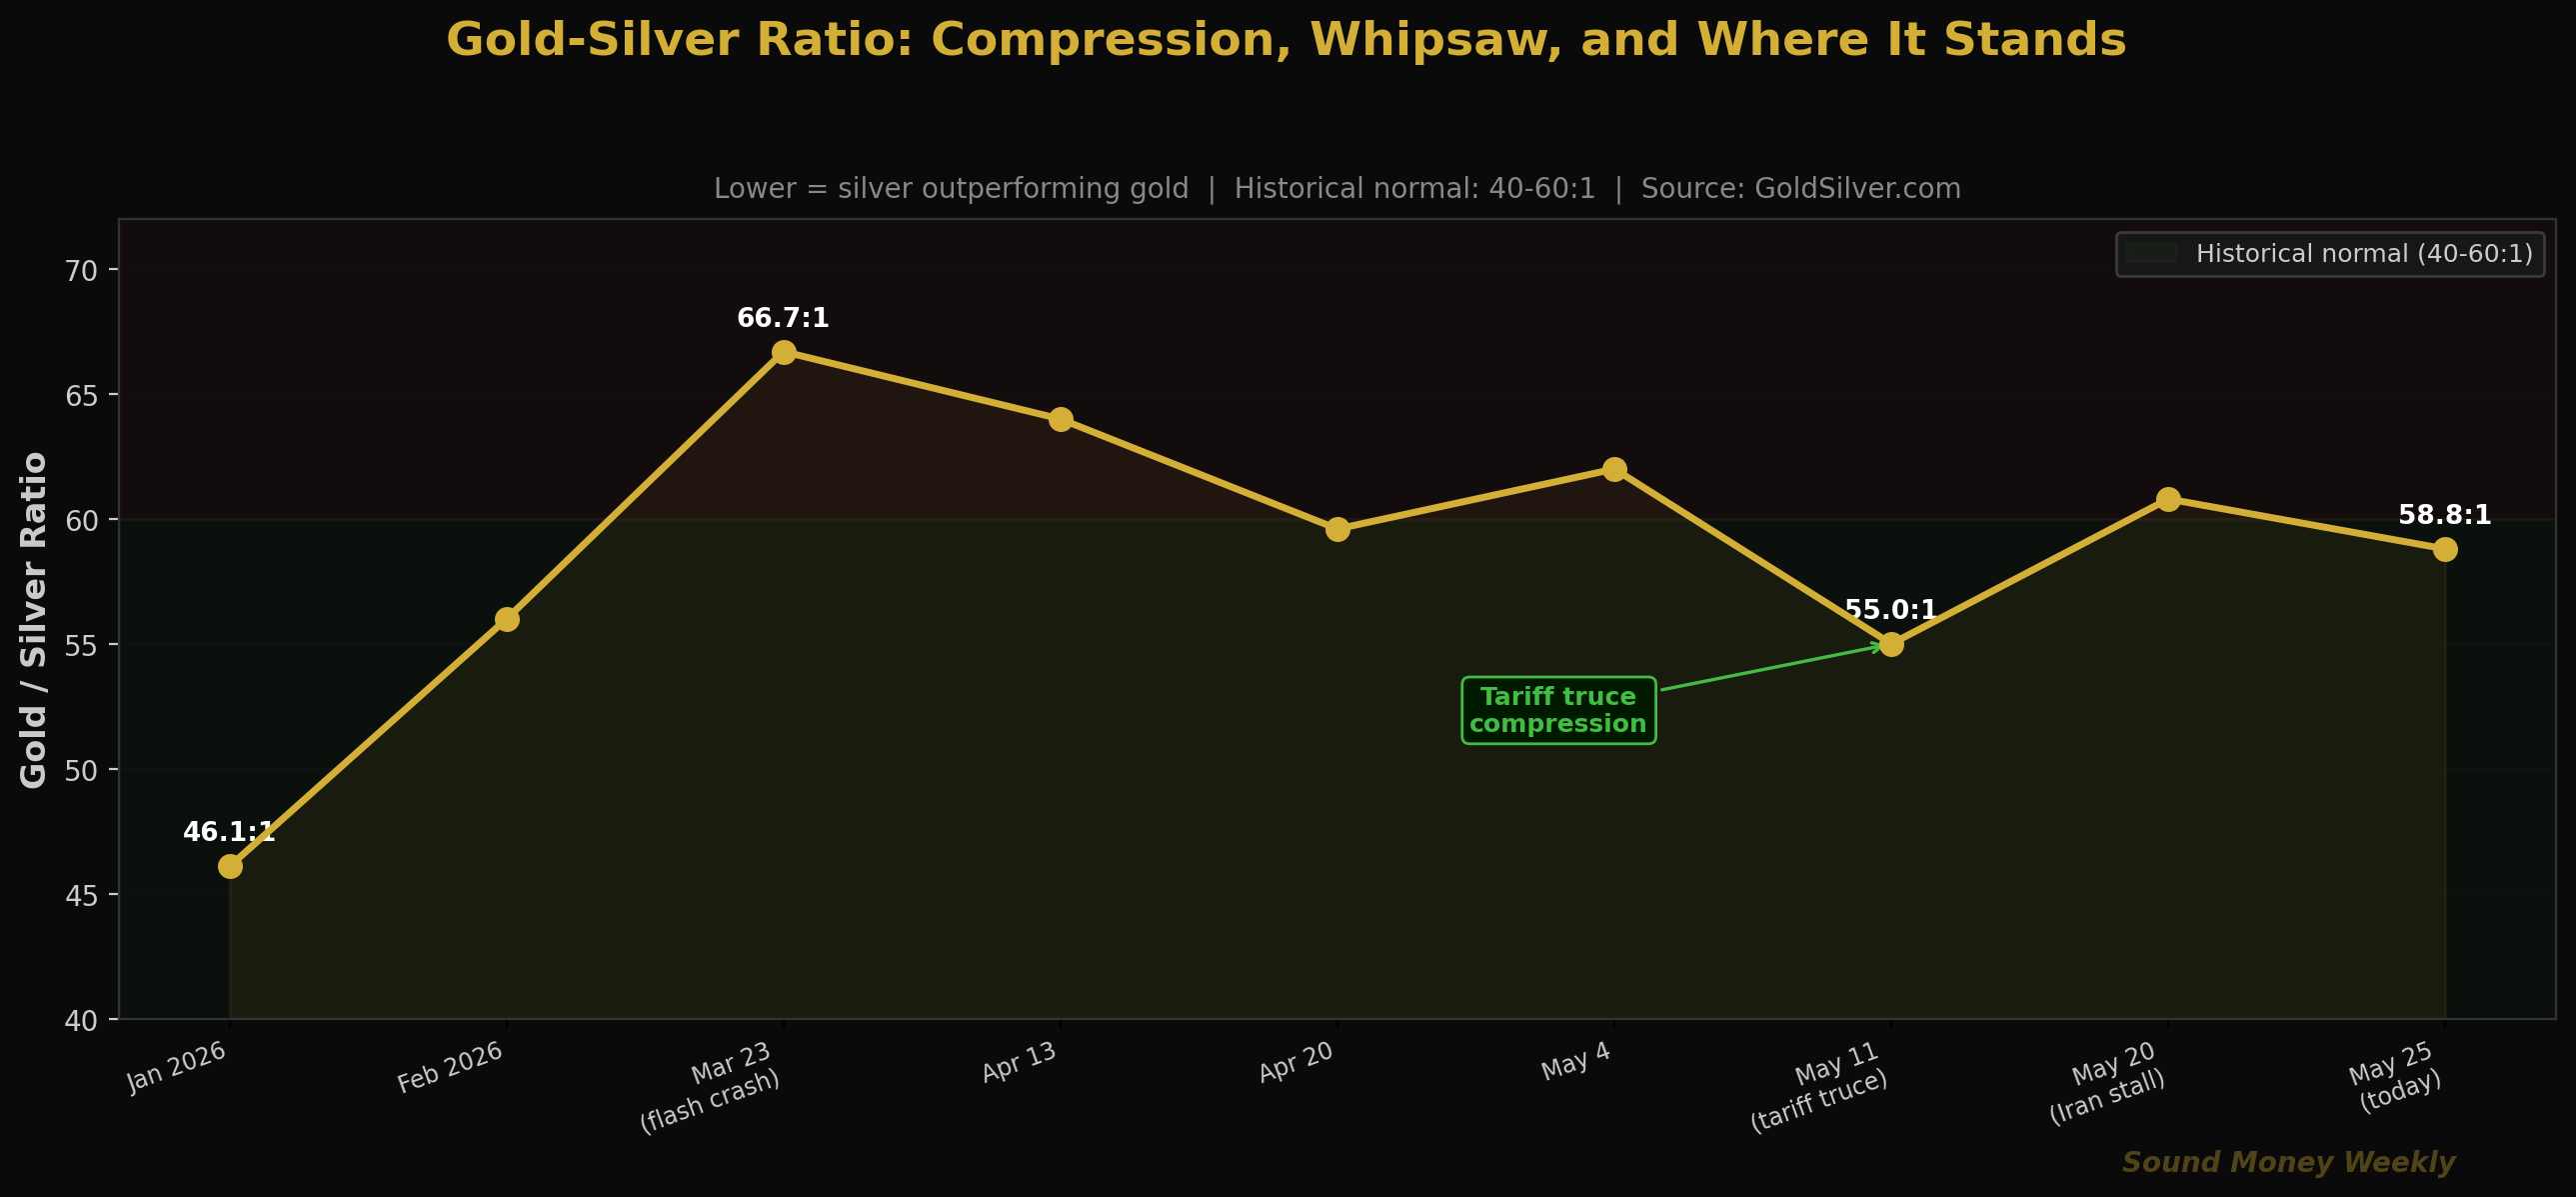
The gold-to-silver ratio spent most of 2025 in historically abnormal territory -- above 60:1, often above 70:1 -- as the Iran conflict drove safe-haven gold buying while silver's industrial component suffered from slower global manufacturing. With the tariff truce and Iran deal progress, those dynamics are reversing.
The ratio's journey this year:
- January 2026: 46:1 (silver at its most expensive relative to gold -- the bull market peak)
- March 23 (flash crash): 66.7:1 (silver sold hardest during the selloff)
- April-May: 62-64:1 range (gradual recovery)
- Tariff truce peak: 55:1 (silver's biggest outperformance of the year)
- Iran stall: Back to 60+:1
- Today: ~58.8:1 ($4,562/$77.60)
The pattern confirms what GoldSilver.com's May 2026 analysis notes: silver's dual nature -- monetary and industrial -- means it can compress the ratio dramatically when risk-on and geopolitical-off signals converge. An Iran deal + sustained trade truce could push the ratio back toward 50:1 or lower, implying significant silver outperformance of gold from here.
The Dual Catalyst: Why Iran and Trade Together Are Different
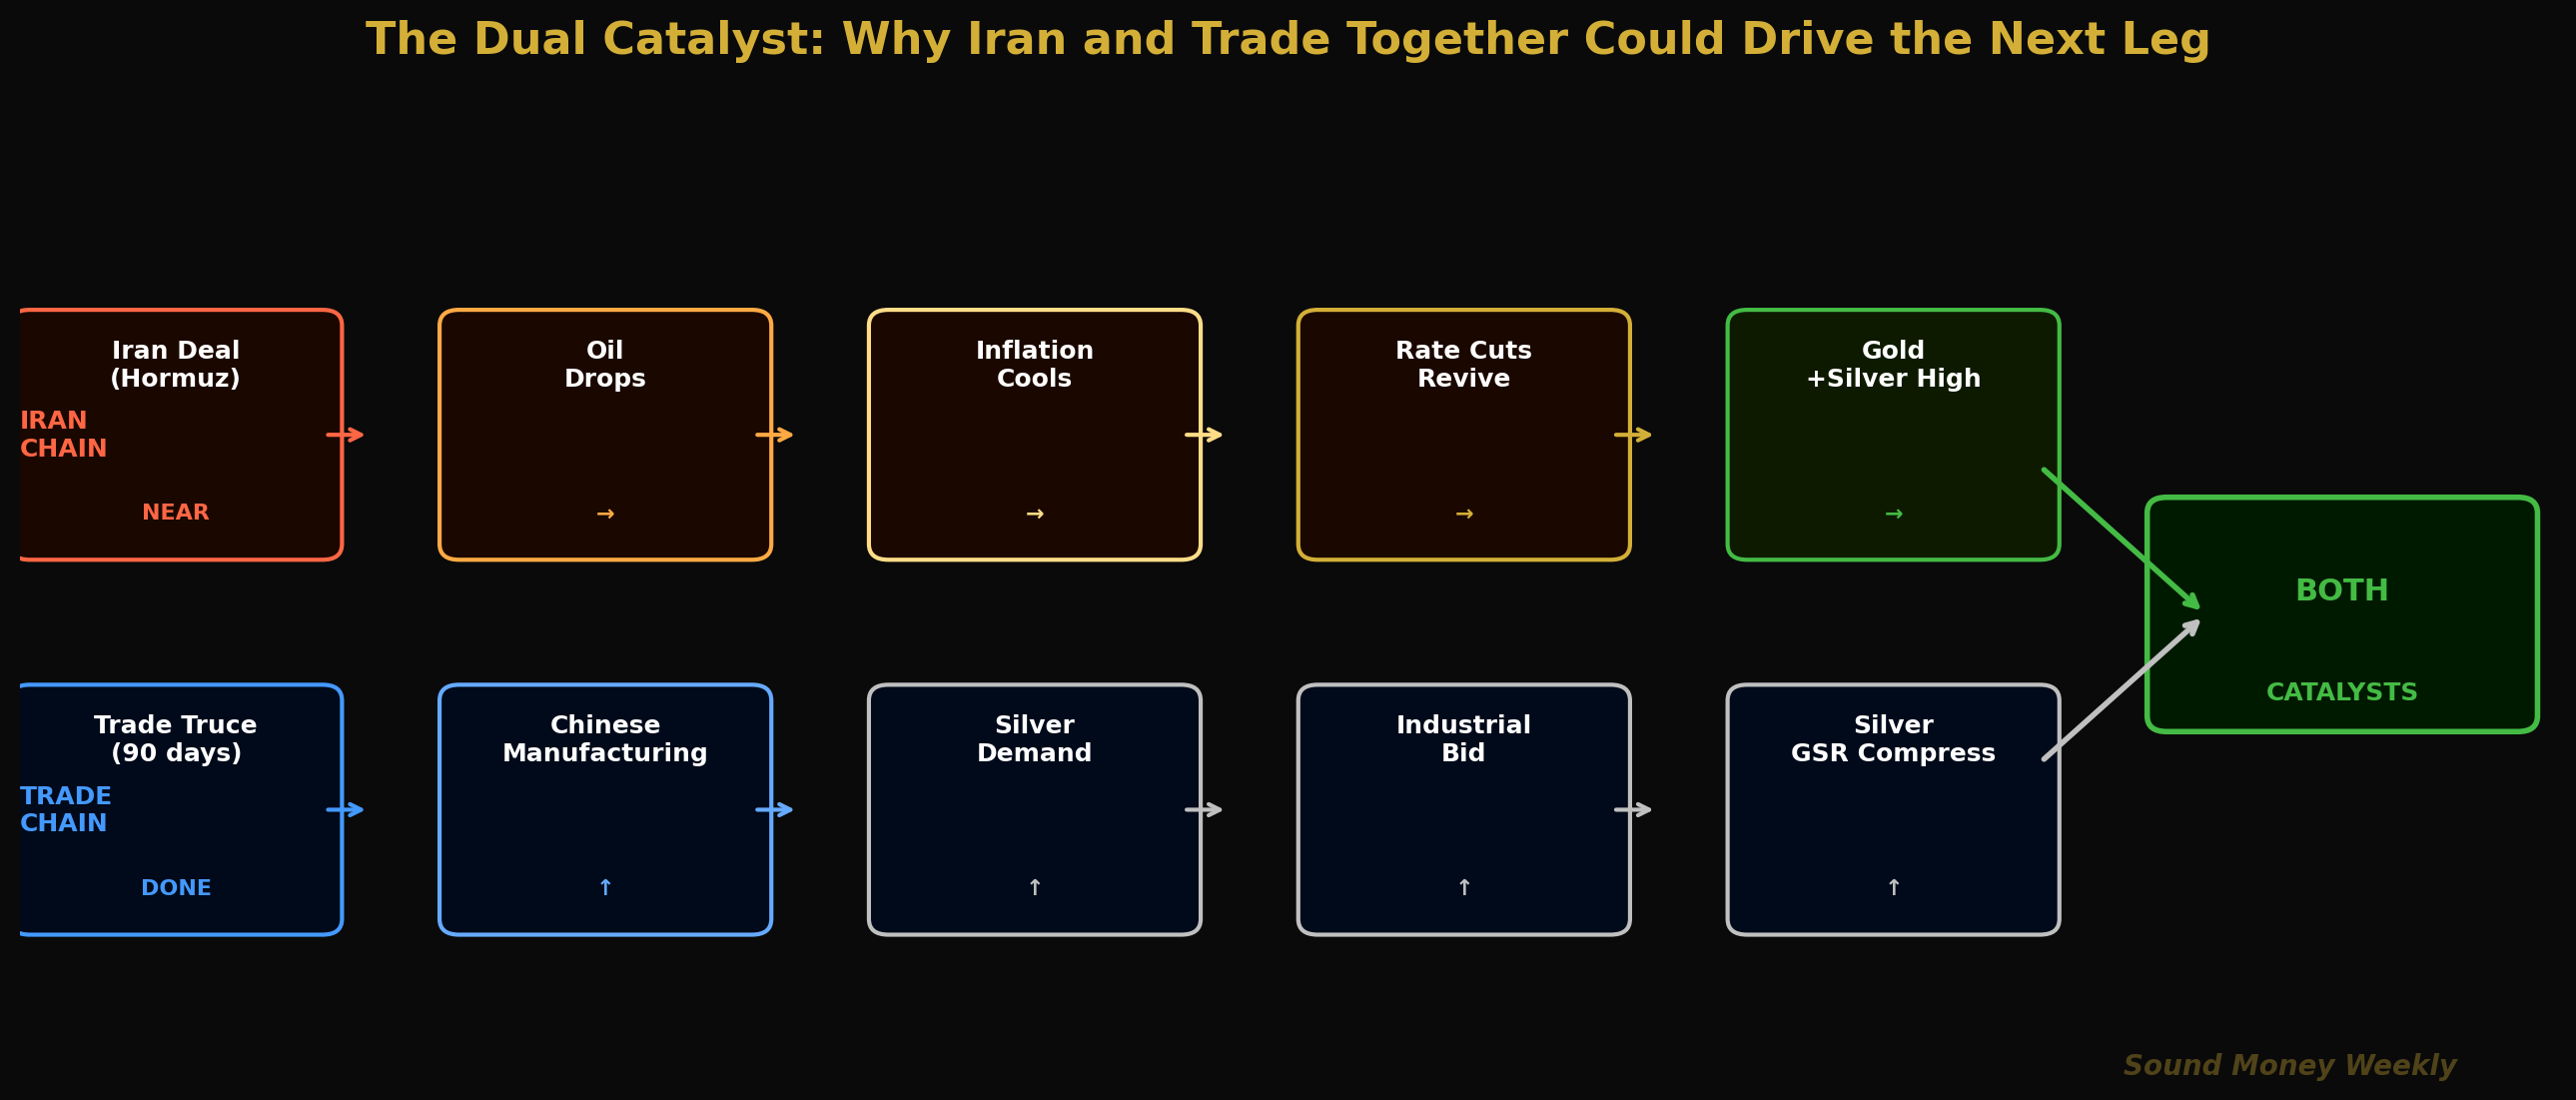
Most market commentary treats the Iran situation and the US-China trade truce as separate stories. They are connected at the structural level -- both affect gold and silver through distinct but reinforcing chains.
The Iran chain: peace deal → Hormuz reopens → oil falls toward $80 → global inflation decelerates → Fed can cut rates → real yields fall → gold rallies (both monetary and geopolitical channels align).
The trade chain: tariff truce holds → Chinese manufacturing activity resumes → global industrial demand recovers → silver demand accelerates → GSR compresses → silver outperforms.
If both hold simultaneously -- and the current momentum suggests they might -- the combination would be the most constructive macro environment for precious metals since before the Iran conflict began in late February. CNBC analysts in May predicted that gold and silver could return to new all-time highs "potentially within this year" if a peace agreement is finalized.
Under the Hood: The Counterintuitive Silver Data
Here is a development that came out this week that most coverage got exactly backwards.
UBS revised its 2026 silver supply deficit estimate from approximately 300 million ounces to 60-70 million ounces. That is a reduction of roughly 75%. Solar manufacturers have successfully reduced silver content per panel faster than expected. The PV industry's silver demand is expected to drop 19% year-over-year in 2026.
The narrative most readers will take from that: "silver's deficit story is broken." That is the wrong conclusion.
A 60-70 million ounce deficit is still a deficit -- the sixth consecutive annual year where global silver demand exceeds mine supply. The world still produces less silver than it consumes. The pace of drawdown from above-ground inventories is slower, but the direction has not reversed. And critically: the thrifting effort is itself evidence of how deeply embedded silver demand has become. Solar manufacturers are redesigning production lines at significant capital cost because silver got expensive enough at $100+ per ounce to justify the engineering investment. That is not a sign of declining relevance. It is a sign of relevance so high that entire industries are restructuring around it.
There is also a growing demand stream that is not being reduced: data center infrastructure. AI-scale data centers draw 60-130 kilowatts per rack -- versus 10-15 kilowatts for a standard enterprise rack. The power hardware required to distribute that density -- switchgear, relays, busbars -- uses silver for its conductivity and arc resistance. Hyperscalers are projecting $736 billion in data center capital expenditure in 2025-2026 combined. Most AI commentary focuses on chips. The overlooked story is that chips need power infrastructure, and power infrastructure needs silver.
Technical View: Where Gold Sits at $4,562
Gold at $4,562 is recovering from the May 20 low of $4,481 but remains below the Fibonacci 0.382 level at $4,654:
| Level | Price | Note |
|---|---|---|
| 50-Day MA (resistance) | ~$4,807 | Key upside target; Iran deal could test it |
| Fib 0.382 (resistance) | $4,654 | Broken during CPI week; first target to reclaim |
| Current | $4,562 | Recovering from the May 20 low; above $4,500 |
| Round-number support | $4,500 | Psychological floor; held through last week |
| Fib 0.500 (major support) | $4,361 | Structural floor unchanged since March |
Gold needs to reclaim $4,654 to confirm the recovery is structural rather than a relief bounce. An Iran deal announcement this week or next could provide that catalyst in a single session.
The DCA Math at $4,562
Gold at $4,562 continues to offer a meaningful discount to the January all-time high:
| Entry Point | Price | Oz per $200 | Annual total (12 mo) |
|---|---|---|---|
| January ATH | $5,608 | 0.03566 oz | 0.428 oz |
| Today | $4,562 | 0.04384 oz | 0.526 oz |
| Silver at $77.60 | -- | 2.577 oz per $200 | 30.9 oz |
At $4,562, a $200 monthly gold purchase acquires 0.04384 ounces -- 22.9% more metal than the same purchase at January's high. If you are also stacking silver at $77.60, the same $200 buys 2.577 ounces.
The Hartford Funds research on missing the best trading days applies directly to this week. Thursday's +1.37% and today's +1.0% are exactly the kind of sessions that compound into the 10.9% annualized return that consistent stackers have captured since 2000. They do not arrive on a schedule. They arrive during periods of maximum narrative uncertainty -- exactly like the period we are in right now.
The people stacking $200/month through March's flash crash, through Powell's final FOMC, through the 3.8% CPI shock, and through this week's silver whipsaw are accumulating gold and silver at an average cost meaningfully below current prices. The structural argument has not changed. The peace deal would only add to it.
The winners in this game are always in the game.
What It Means
Here is the plain-English version.
Gold is rallying on good news today -- and understanding the mechanism matters. An Iran deal → Hormuz reopening → oil falls → inflation cools → the Fed can cut → real yields drop → gold goes up. This is the same structural pathway that drove gold to $5,608. The war interrupted it. A peace deal would restart it. That is why gold is up today on optimism rather than fear.
Silver had its most volatile week of 2026, and the direction was ultimately higher. Three moves in three days: -5%, +3%, +3%. Despite the whipsaw, silver closed the week above where it started and the GSR is meaningfully tighter than it was before the tariff truce. The dual-channel nature of silver -- monetary and industrial -- means both catalysts (Iran deal and trade peace) benefit it simultaneously.
UBS cutting the silver deficit estimate is not bad news. It is evidence of structural demand so strong that manufacturers redesigned production around it. A 60-70 million ounce deficit is still a deficit. The sixth in six years. And the AI infrastructure demand building in the background is not subject to thrifting -- switchgear and relays require silver for properties that copper cannot substitute.
The summer setup is the most constructive in months. Iran deal progress. US-China trade truce holding. Silver GSR compressing. Rate-hike risk fading. Goldman Sachs, J.P. Morgan, and every major bank still targeting $5,400-$6,300. If the Iran deal closes in June, the combination of lower oil, falling inflation expectations, and returning rate-cut pricing could send gold through $4,807 (the 50-day MA) and toward the prior highs in a compressed time frame.
This is not a recommendation. We do not know if the Iran deal closes this week or drags into July. We do know that the structural forces that drove gold to $5,608 -- CB buying, deficit spending, dollar debasement, silver shortages -- have not resolved. They have simply been temporarily outweighed by the rate-hike narrative. That narrative shifts the moment Hormuz opens and oil falls.
What We're Watching
The Iran deal timeline. Reports this morning cite "nearing a deal" on Hormuz. Any formal announcement -- even a partial reopening framework -- would be the single largest positive catalyst of the year for gold and silver. Watch the Iran-Pakistan diplomatic channel and Trump's social media for signals.
June FOMC (June 10-11). The first Warsh-era meeting. Even if rates stay unchanged, Warsh's communication tone will set expectations for H2 2026. Any softening language on inflation (acknowledging that oil's retreat may help) would revive rate-cut pricing and give gold a near-term catalyst.
May CPI (June 10). If Brent continues retreating from the $112 peak toward $80-85 in a post-deal scenario, May CPI could drop sharply from April's 3.8% back toward 2.5-2.8%. That one data point could reprice the entire 2026 rate path.
Silver's $80 level. Silver at $77.60 today is approaching the $80 level that served as a floor in January before the Iran conflict disruption. A sustained close above $80 would signal the GSR compression is resuming and silver is re-establishing its pre-conflict trading range.
The UBS deficit revision. Watch for Silver Institute's updated 2026 projections in response to the UBS analysis. If additional analysts revise deficit estimates lower, the narrative around silver's supply story will shift -- but recall the key insight: even a smaller deficit is still a deficit, and the AI infrastructure demand stream has not been factored into most existing projections.
Until Next Week
The Strait of Hormuz is a 21-mile-wide channel. Roughly 20% of the world's seaborne oil passes through it. Iran has had effective control of access since late February. In that time: oil surged from $68 to $112, inflation went from 2.4% to 3.8%, rate cut expectations were eliminated, and gold pulled back 19% from its all-time high.
Reverse the chain and you get a different movie. Oil at $80. Inflation cooling toward 2.5%. Rate cuts returning to the calendar. Gold free to run toward the $5,400-$6,300 targets that every major bank has held through the entire correction.
The tanker on the cover of this week's article is not a metaphor. It is a ship waiting to transit. If the deal closes, thousands of ships like it move through freely. Oil drops. The summer looks different.
At $4,562, consistent stackers are acquiring 22.9% more gold per dollar than they did in January. If the summer unfolds the way the institutional targets suggest, those extra ounces carry significant value. The structural case -- 18 years of central bank net buying, the AI silver demand building beneath the thrifting narrative, the deficit that persists despite manufacturers redesigning around it -- remains unchanged.
The winners in this game are always in the game. See you next Monday.
Sound Money offers fractional gold and silver ownership at whole-ounce pricing -- no minimums, no premiums. Learn more at sound.money.
Disclaimer: This content is provided by Sound Money for educational and informational purposes only. Nothing published here constitutes investment advice, financial advice, trading advice, or any other form of professional advice. Sound Money is not a registered investment advisor, broker-dealer, or financial planner. The information presented reflects our analysis of publicly available data and should not be relied upon as a basis for investment decisions. Precious metals investments carry risk, including the potential loss of principal. Past performance does not guarantee future results. Always consult a qualified financial advisor before making investment decisions. For more information, visit sound.money.
- gold
- silver
- precious-metals
- iran
- hormuz
- us-china-trade
- gold-silver-ratio
- rate-cuts
- weekly-update