The World Mined 470 Tonnes More Gold Than We Thought
The World Gold Council revised mine supply up by about 470 tonnes. We check the numbers behind gold's blind spots: artisanal mining, hidden central-bank buying, India.
Gold just had its best week since August. Front-month COMEX gold settled Friday at $4,064.50, up 4.60% on the week, according to Dow Jones Market Data, ending a three-week losing streak. Silver gained 5.51% to $51.803. (COMEX is the New York futures exchange where much of the world's gold price is set.) That is the number most people will talk about.
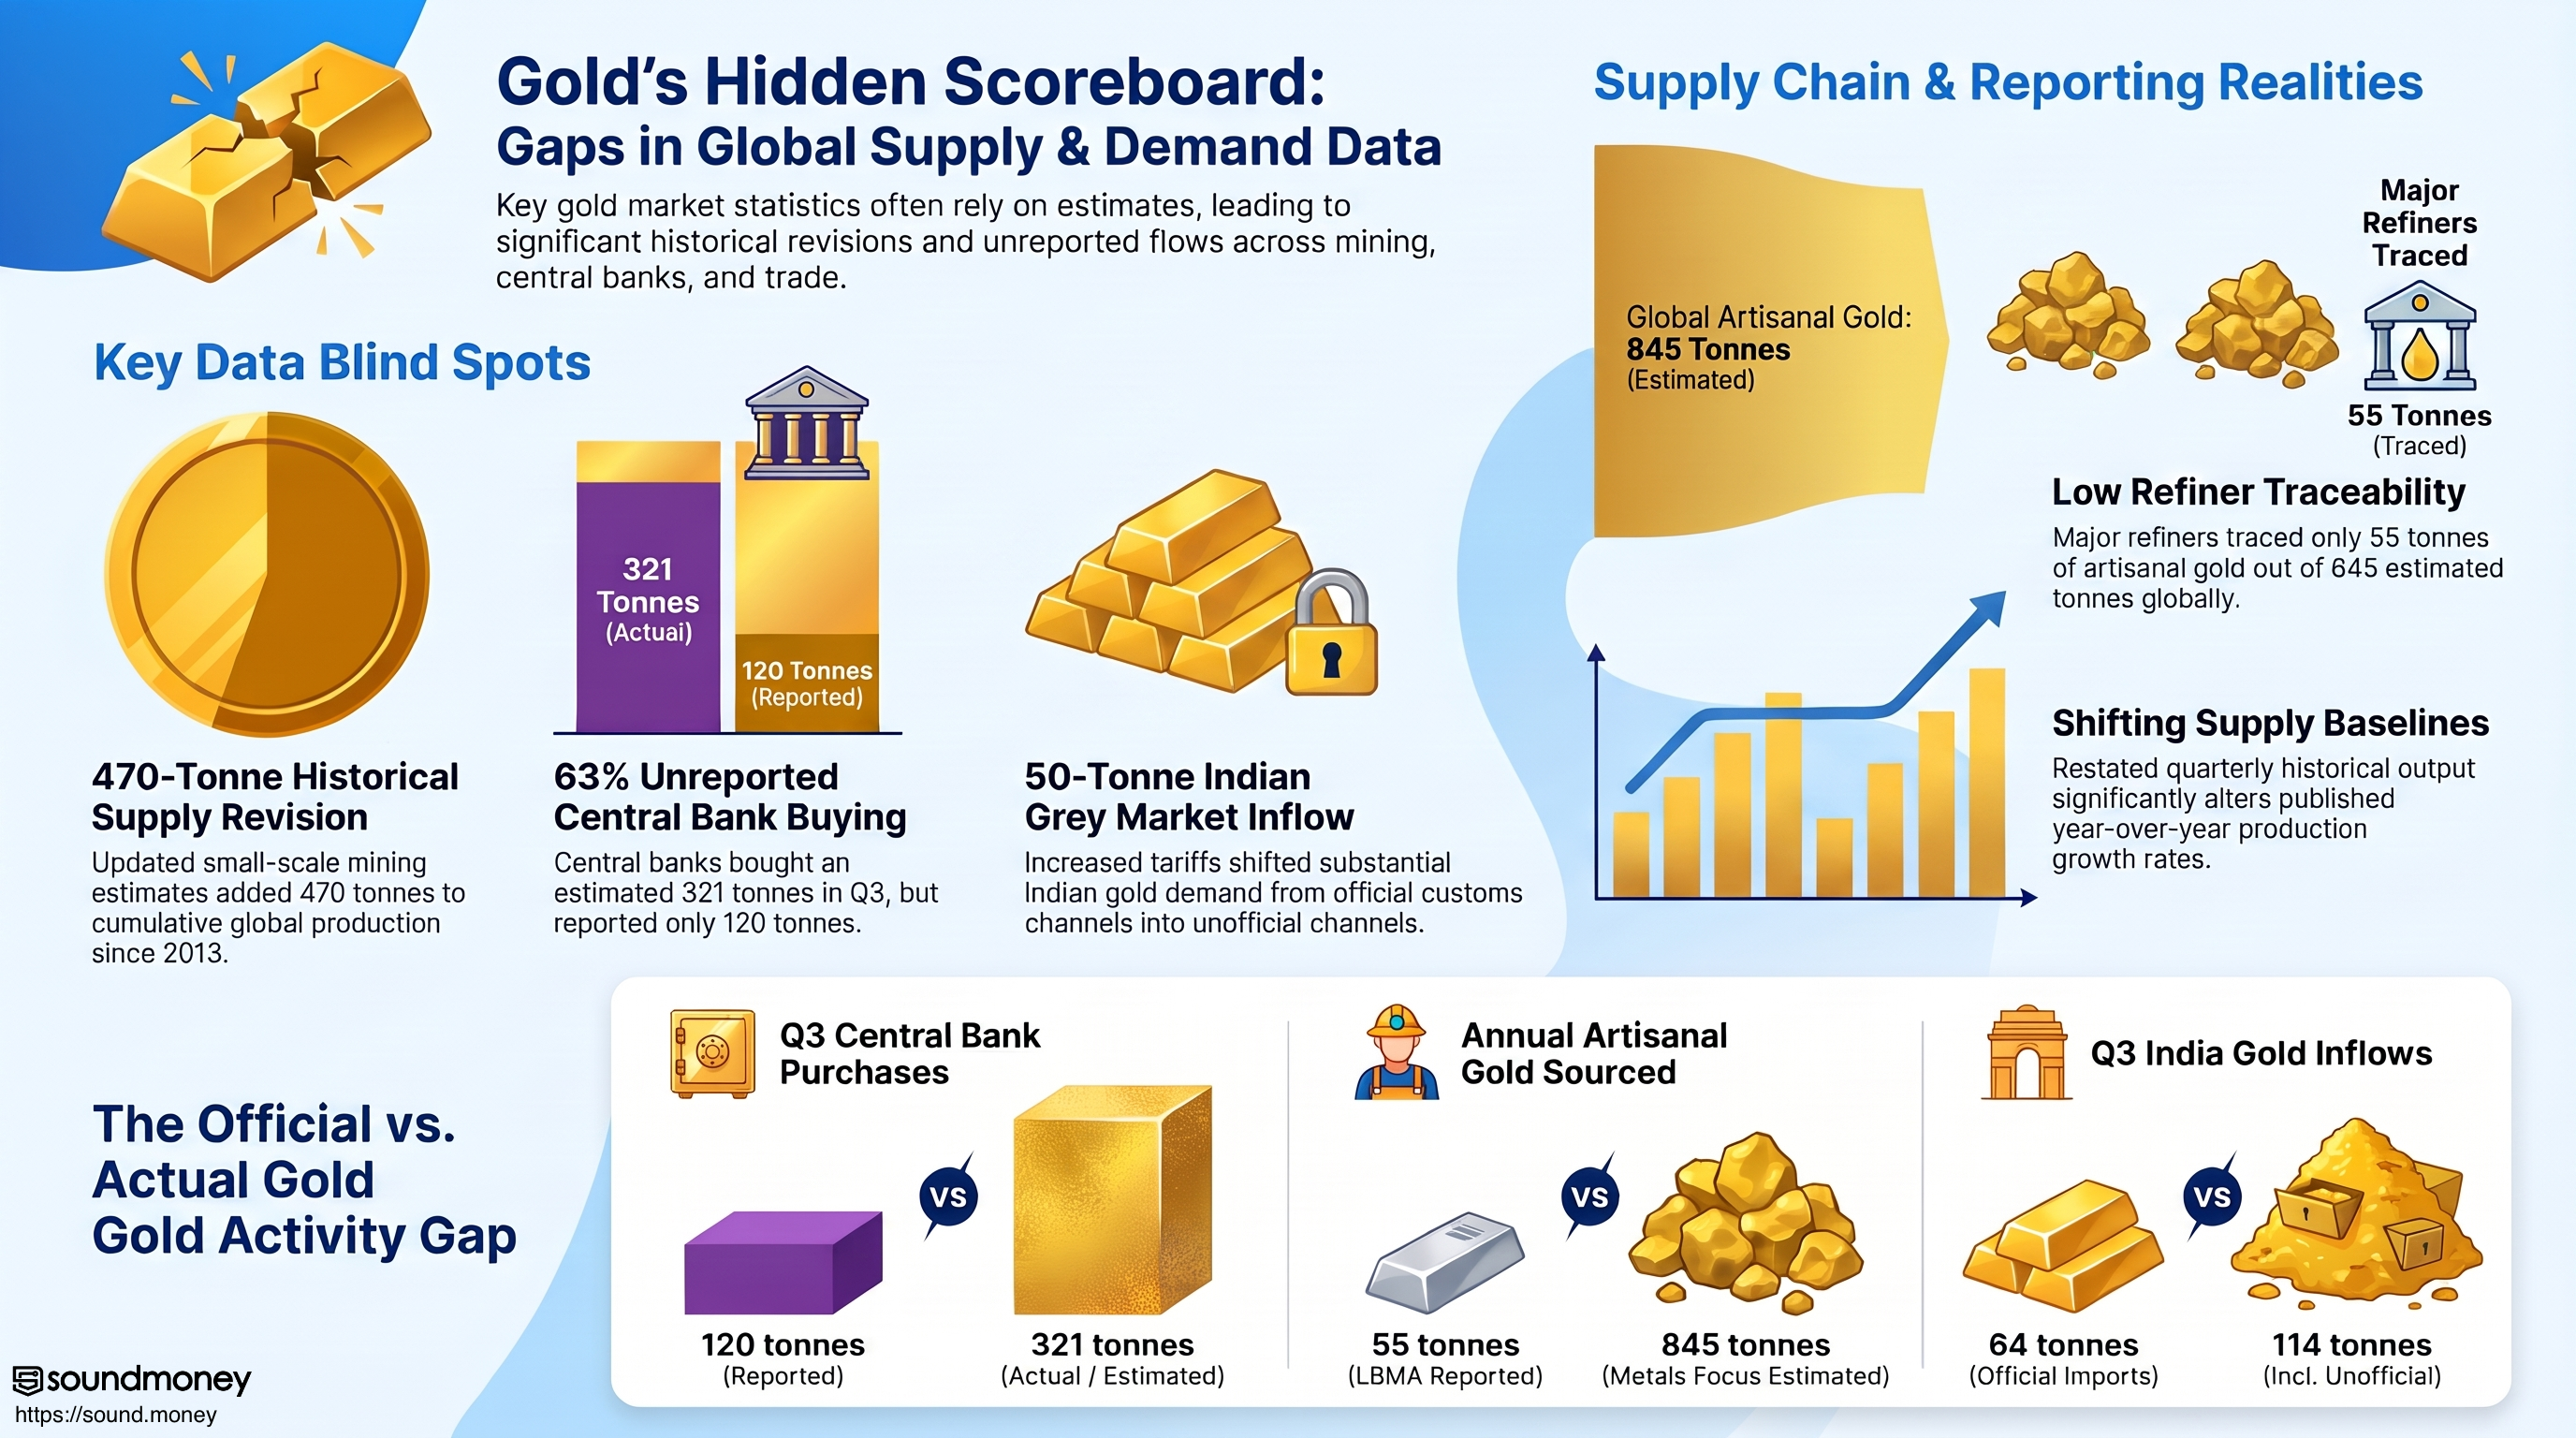
We think a quieter number, published the same week, tells you more. On November 3, the World Gold Council (WGC, the industry body that publishes the most-cited gold supply and demand statistics) said its data partner Metals Focus had revised its history of mine production upward. Better data on small-scale miners in four Latin American countries added approximately 470 tonnes to cumulative global mine production since 2013.
Nobody dug up 470 tonnes of gold last week. The metal was already out there. We just did not know about it. That is the interesting part: gold is the most closely watched metal on earth, and parts of its scoreboard are still estimated rather than counted.
This week we look at where the blind spots are, check a few headline numbers ourselves, and explain why none of it changes the arithmetic of steady stacking.
The Story
The 470-tonne revision
The revised gold comes from artisanal and small-scale gold mining, usually shortened to ASGM: individuals, families and small crews working outside the big corporate mines, often without formal reporting. The WGC says ASGM is estimated at around one fifth of annual gold production and supports some 20 million livelihoods, and that it is "one of the hardest segments of the supply chain to measure with confidence."
The new estimates cover Brazil, Guyana, French Guiana and Suriname. Brazil contributes the largest share. The WGC adds that "we are likely to see further revisions to mine production estimates over coming quarters."
Put in proportion: 470 tonnes is about 13% of one year's output, measured against 2025 mine production of 3,672 tonnes (our arithmetic). But it is spread across roughly thirteen years of history. This is a bookkeeping correction, not a new discovery.
Same quarter, two answers
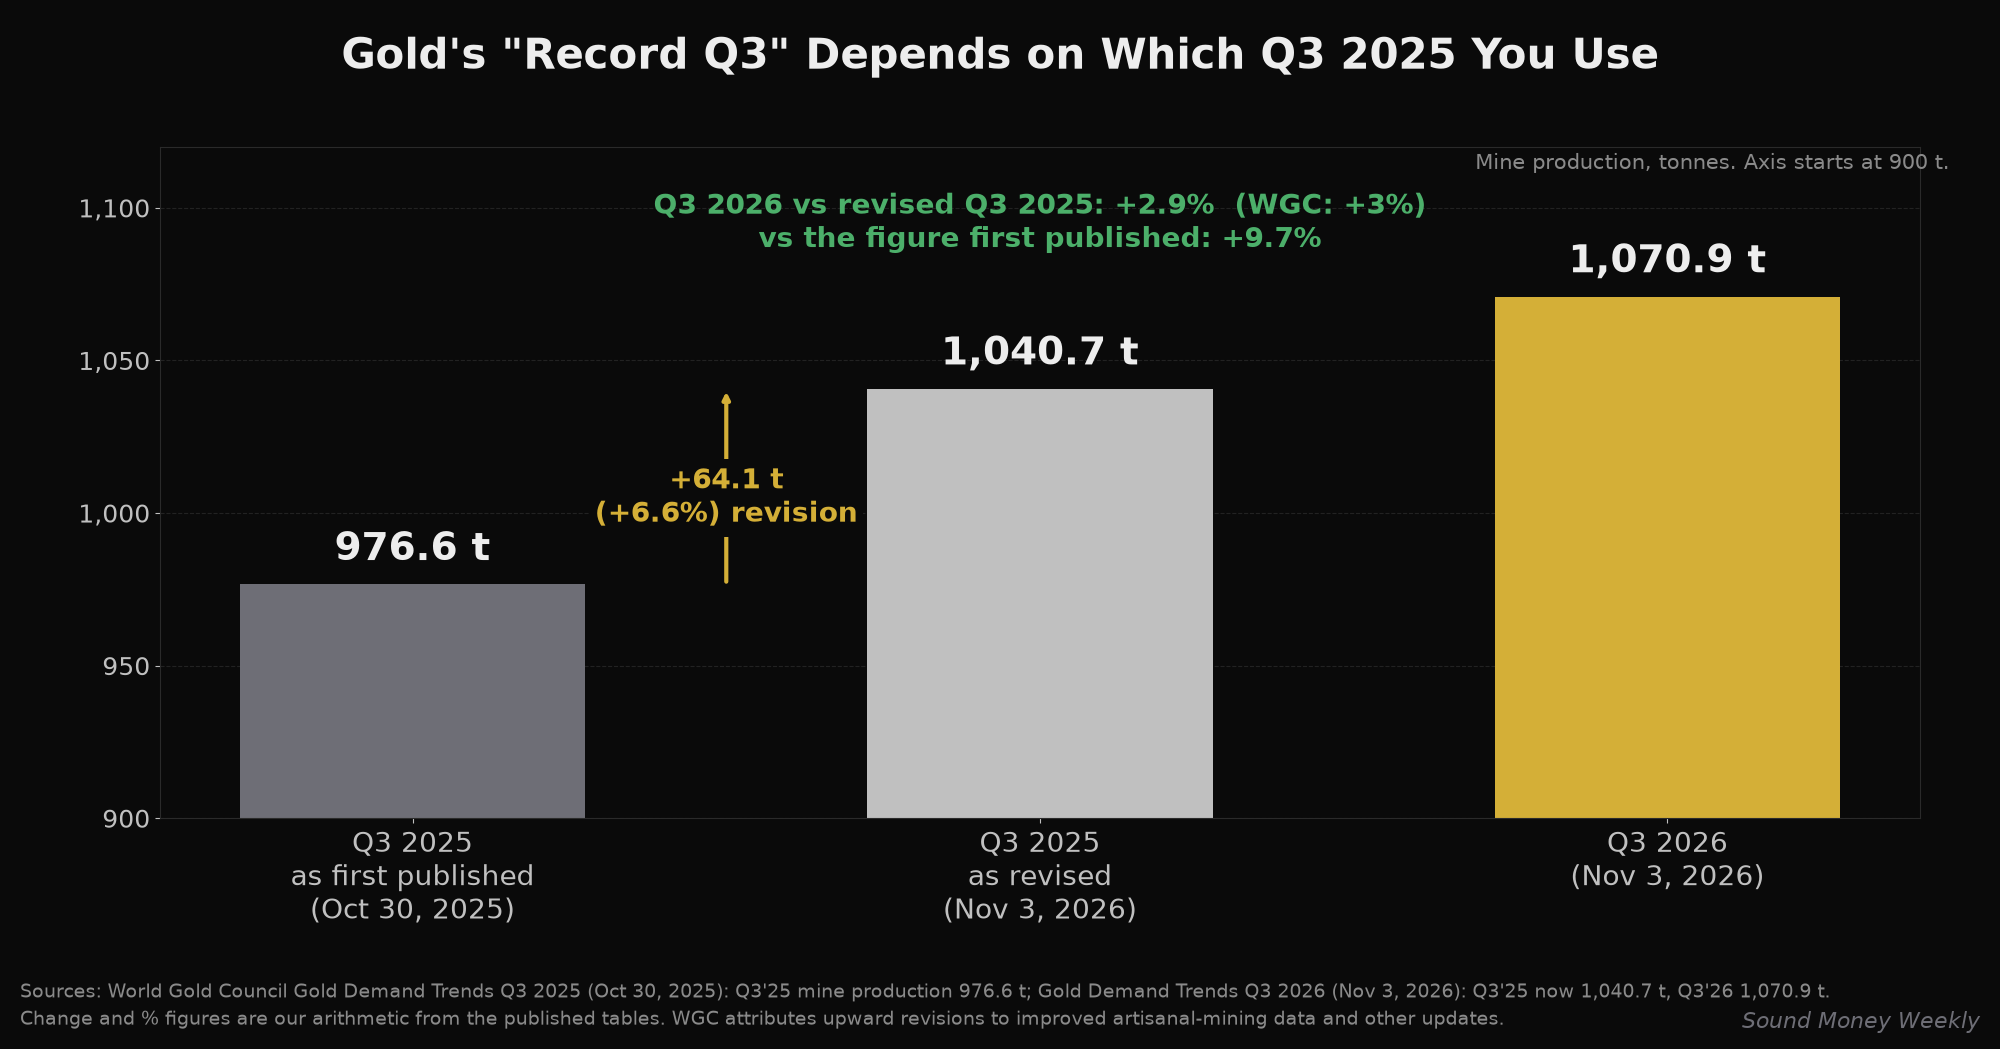
Here is a check we ran ourselves. The WGC's Q3 2026 report says mine production hit a record 1,071 tonnes, up 3% on a year earlier. That is true against the revised base. But when the WGC first published Q3 2025, it reported 976.6 tonnes. The same quarter now reads 1,040.7 tonnes, a revision of 64.1 tonnes (+6.6%).
Against the figure first published, Q3 2026 would show growth of 9.7%, not 3%. Neither is wrong. The WGC says openly that its first estimates get revised, and the revision comes from better data on artisanal output among other updates. The lesson for readers is simple: a year-on-year change in gold supply compares two estimates made at different times, and the older one tends to move.
Refiners see only a sliver
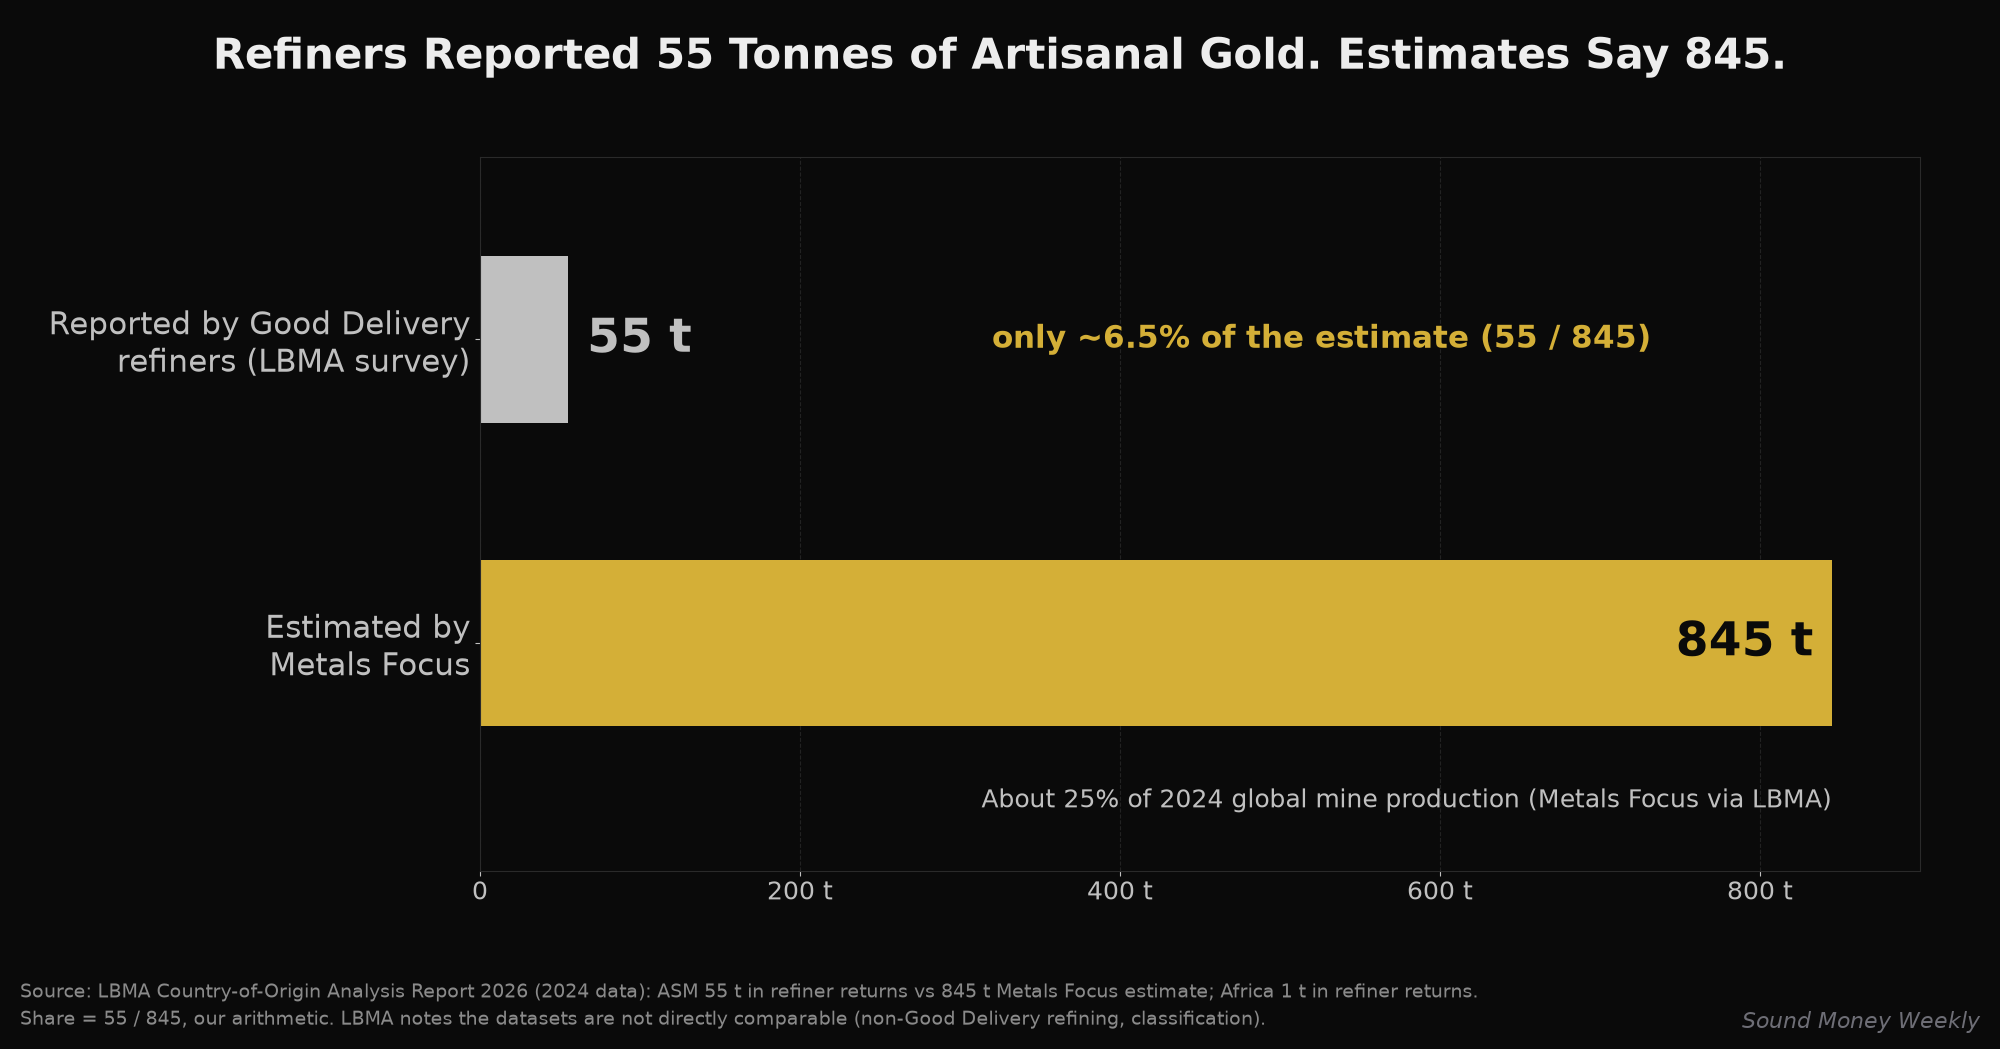
Where does artisanal gold go? Much of it never touches the refiners that anchor the London market. The LBMA (the London Bullion Market Association, which maintains the Good Delivery List of refiners whose bars the market accepts) surveys those refiners on where their raw material came from. For 2024, the refiners identified 55 tonnes as artisanal, against a Metals Focus estimate of about 845 tonnes, roughly 25% of global mine production. That is about 6.5% of the estimate (our arithmetic). Africa, which Metals Focus identifies as the largest artisanal region, accounted for just 1 tonne in the refiner data.
The LBMA is careful here, and so should we be. It says the two datasets are not directly comparable and that much of the gap likely reflects artisanal gold processed outside the Good Delivery network, plus some material reported under other categories. A difference in definitions is not a scandal. But it shows how much of the supply chain sits outside the formal view.
Central banks: the visible tip
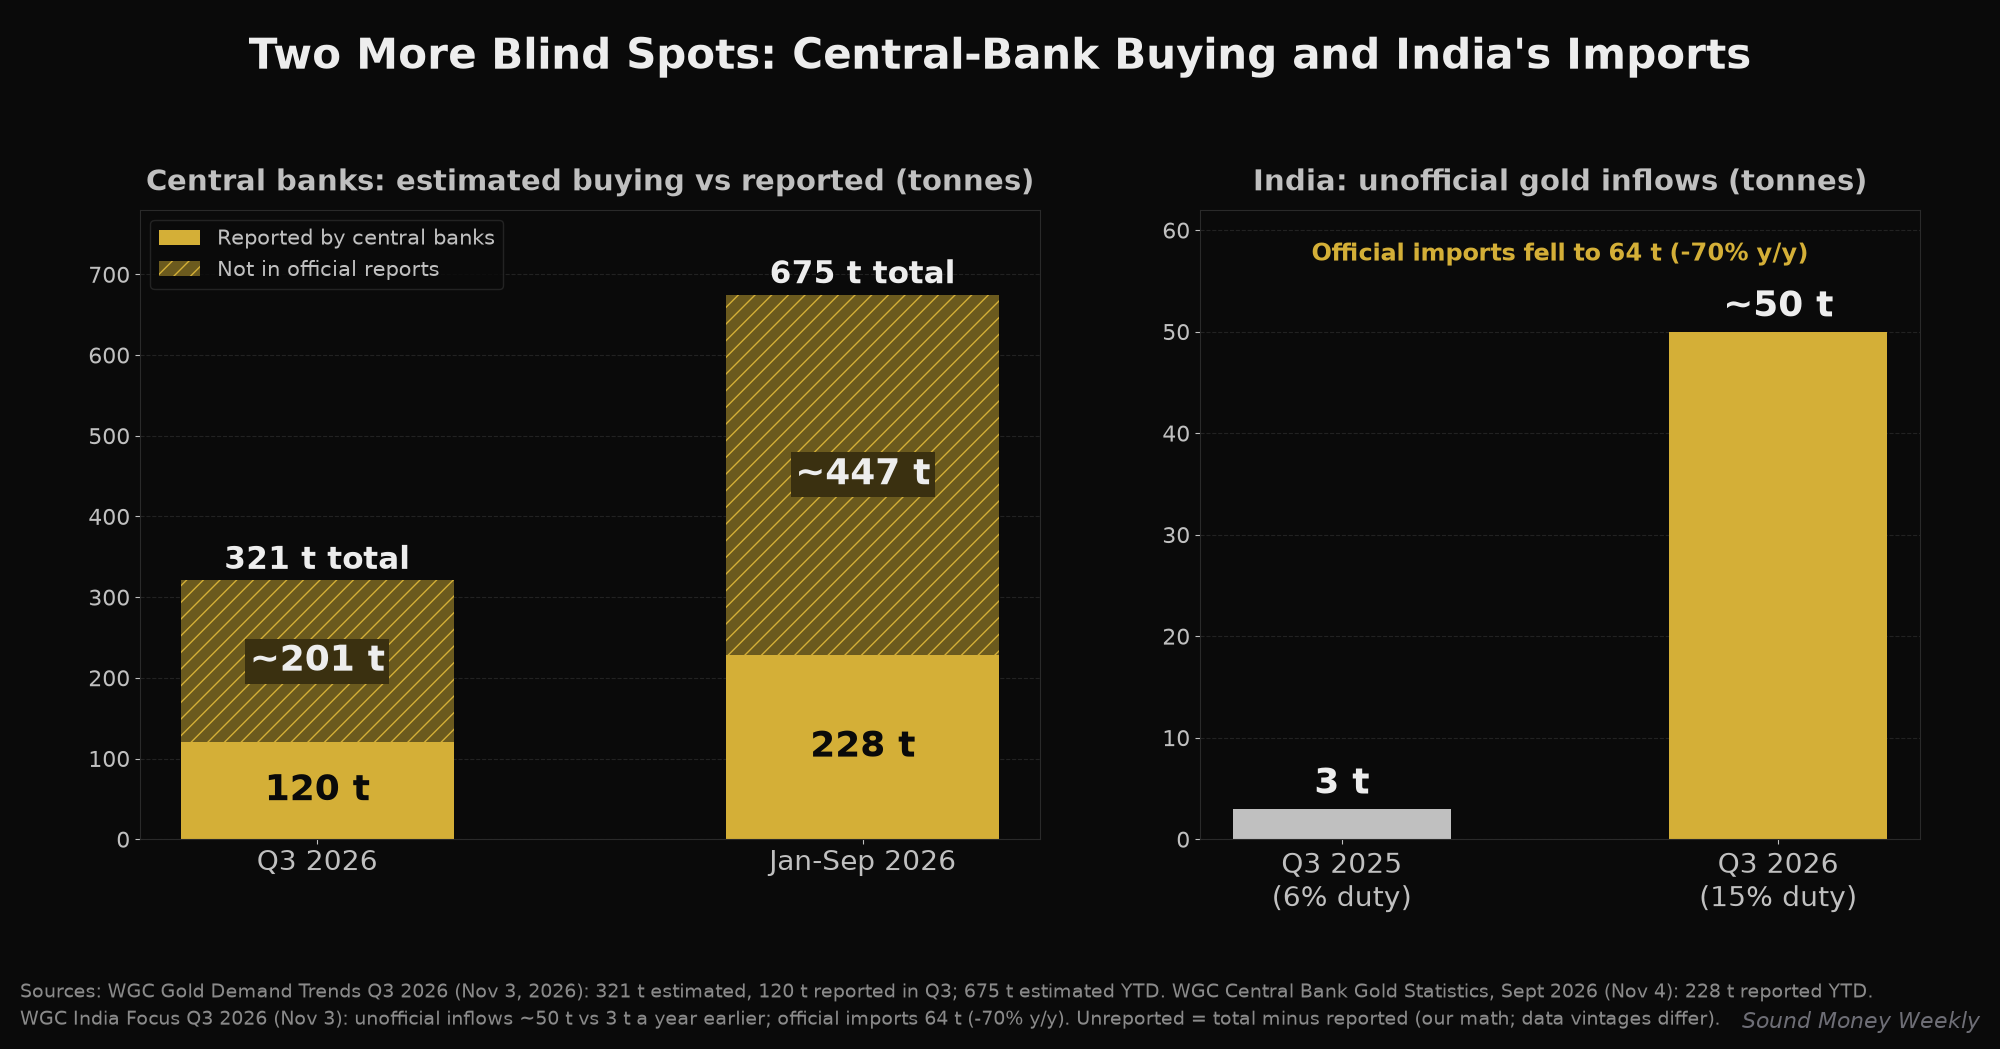
The same pattern appears on the demand side. The WGC estimates central banks bought 321 tonnes in Q3, but reported only 120. Unreported activity was "around 63%" of the quarter's demand, continuing a pattern evident since 2022. For the year to date, the WGC's total is 675 tonnes while reported purchases stand at 228 tonnes.
What is visible keeps growing. China's official reserve table, published Saturday, shows holdings rising from 77.47 to 78.30 million ounces in October. That is +830,000 ounces, about 25.8 tonnes by our conversion.
Under the Hood
Why gold is hard to count
Mines report production. Customs agencies report imports. Central banks report holdings, some months later. Refiners report where their feed came from. Each is a partial view, and they overlap imperfectly. Once gold is melted and refined, a bar from a small-scale miner and a bar from a large mine can look the same, which is why the WGC is working on origin-verification technology and better ASGM models.
India's grey channel
India shows the same blind spot from the trade side. After the import duty rose from 6% to 15% in May, the WGC says official bullion imports fell to 64 tonnes in Q3, down 70%. Estimated unofficial inflows rose to about 50 tonnes, from 3 tonnes a year earlier. Domestic gold traded at a record average discount of $43 an ounce to import parity (the price of imported gold including duty), which the WGC attributes partly to those unofficial flows. If you read only India's customs data, you would see demand collapse. The estimate suggests part of it moved out of the official statistics.
A number we could not reproduce
Bloomberg reported on October 27 that volume in the Shanghai Gold Exchange's popular Au99.99 contract jumped to "43 million lots, or around 430 tons" in a week. The exchange's own weekly report for October 19 to 23 lists Au99.99 at 57,025 kilograms, about 57 tonnes, up 31.6% from 43,328 kilograms the week before. We could not get from that table to 430 tonnes, and a units or contract-size mix-up is one possible explanation. We are flagging the gap, not the intent. The demand signal of rising volume holds under either figure, but the size is roughly an eighth of the headline.
The skeptic's case
A fair skeptic could say: if more gold was mined than we thought, more metal exists than assumed, and supply is less tight than the story goes. That is a reasonable reading. The scale matters, though. The 470 tonnes is spread across thirteen years, while central banks alone were estimated to buy 321 tonnes in a single quarter. Revisions to the past can change the narrative. They do not change what an ounce is or how a scheduled buyer accumulates it.
What It Means
Let's translate this into plain English.
For gold: the market's statistics are good, not perfect. Treat precise-looking supply and demand figures as estimates with error bars, and expect more revisions as artisanal mining is measured better. Headlines that lean on a single number, in either direction, deserve a second look.
For silver: the week's 5.51% gain is a reminder of how sharply it moves in both directions, and the same caution about estimates applies to any supply table you read.
For the DCA investor, the arithmetic is unchanged by any revision:
- At Friday's front-month settle of $4,064.50, $200 buys 0.0492 oz of gold. On October 30, at $3,885.70, it bought 0.0515 oz. The rally meant about 4.4% fewer ounces per $200 than a week earlier.
- At the January 29 record of $5,318.40, the same $200 bought 0.0376 oz. Friday's price still buys about 31% more ounces per dollar than the record.
- On silver: at $51.803, $200 buys 3.86 oz, against 4.07 oz at the October 30 settle of $49.097.
- Twelve monthly purchases of $200 at Friday's gold settle would total roughly 0.59 oz (illustrative, at a fixed price, excluding fees).
(Prices are Dow Jones Market Data front-month COMEX settles; ounces are $200 divided by price, our arithmetic.)
None of this needs a forecast. A schedule buys the same dollars each month whether the statistics get revised, the price rises, or it falls. What changes is the number of ounces, which is exactly what consistency is for.
What We're Watching
- Tuesday, November 10: US October CPI. The BLS says it will not publish 12-month percent changes for most indexes, because the 2025 shutdown left no October 2025 price survey. Only monthly changes will appear, so expect headlines to lean on a single month.
- Friday, November 13: producer prices (PPI). The other inflation print of the week, per Kitco's calendar.
- December 8 to 9: the Fed meeting. Futures were pricing roughly a 65% chance of a hike on LSEG data on Friday. Other sources quote higher odds, so check the live number.
- More ASGM revisions. The WGC and Metals Focus say further changes are likely. Each one nudges the historical record, so compare year-on-year figures with care.
- India after Diwali (November 8). Import and premium data over the coming weeks will show whether the unofficial channel keeps growing next to the official one.
- Central-bank tables. Poland's and others' October holdings will show how much of the hidden buying becomes visible.
We will be back next Monday with the post-CPI read.
This week's story comes down to one question: how well can you see what you own? At Sound Money, metal you buy is delivered to VaultMax and held there on your behalf as allocated physical gold, and you can request physical delivery or sell it back to Sound Money whenever you choose. Sound Money exists to make consistent precious metals accumulation accessible. You can learn more at sound.money.
Disclaimer: This content is provided by Sound Money for educational and informational purposes only. Nothing published here constitutes investment advice, financial advice, trading advice, or any other form of professional advice. Sound Money is not a registered investment advisor, broker-dealer, or financial planner. The information presented reflects our analysis of publicly available data and should not be relied upon as a basis for investment decisions. Precious metals investments carry risk, including the potential loss of principal. Past performance does not guarantee future results. Always consult a qualified financial advisor before making investment decisions. For more information about Sound Money's products and services, visit sound.money.
- gold
- precious-metals
- mine-supply
- artisanal-mining
- central-banks
- india
- world-gold-council
- gold-data