Three governments tried to control gold this week. One taxed it. One discounted it. One quietly bought 81% more. Here is what the Asia story reveals about the metal's structural demand.
Gold Always Finds a Way: The Asia Story That Changes How You Think About Demand
Sound Money Weekly | June 1, 2026
The Hook
Most gold market commentary focuses on the Fed, rates, the dollar, and geopolitical risk. All of those matter. But the most revealing stories about gold's structural demand often come from the places where governments try hardest to control it -- and fail.
This week, three different Asian governments intervened in the gold market in three different ways. What happened next is more instructive than any Fed press conference.
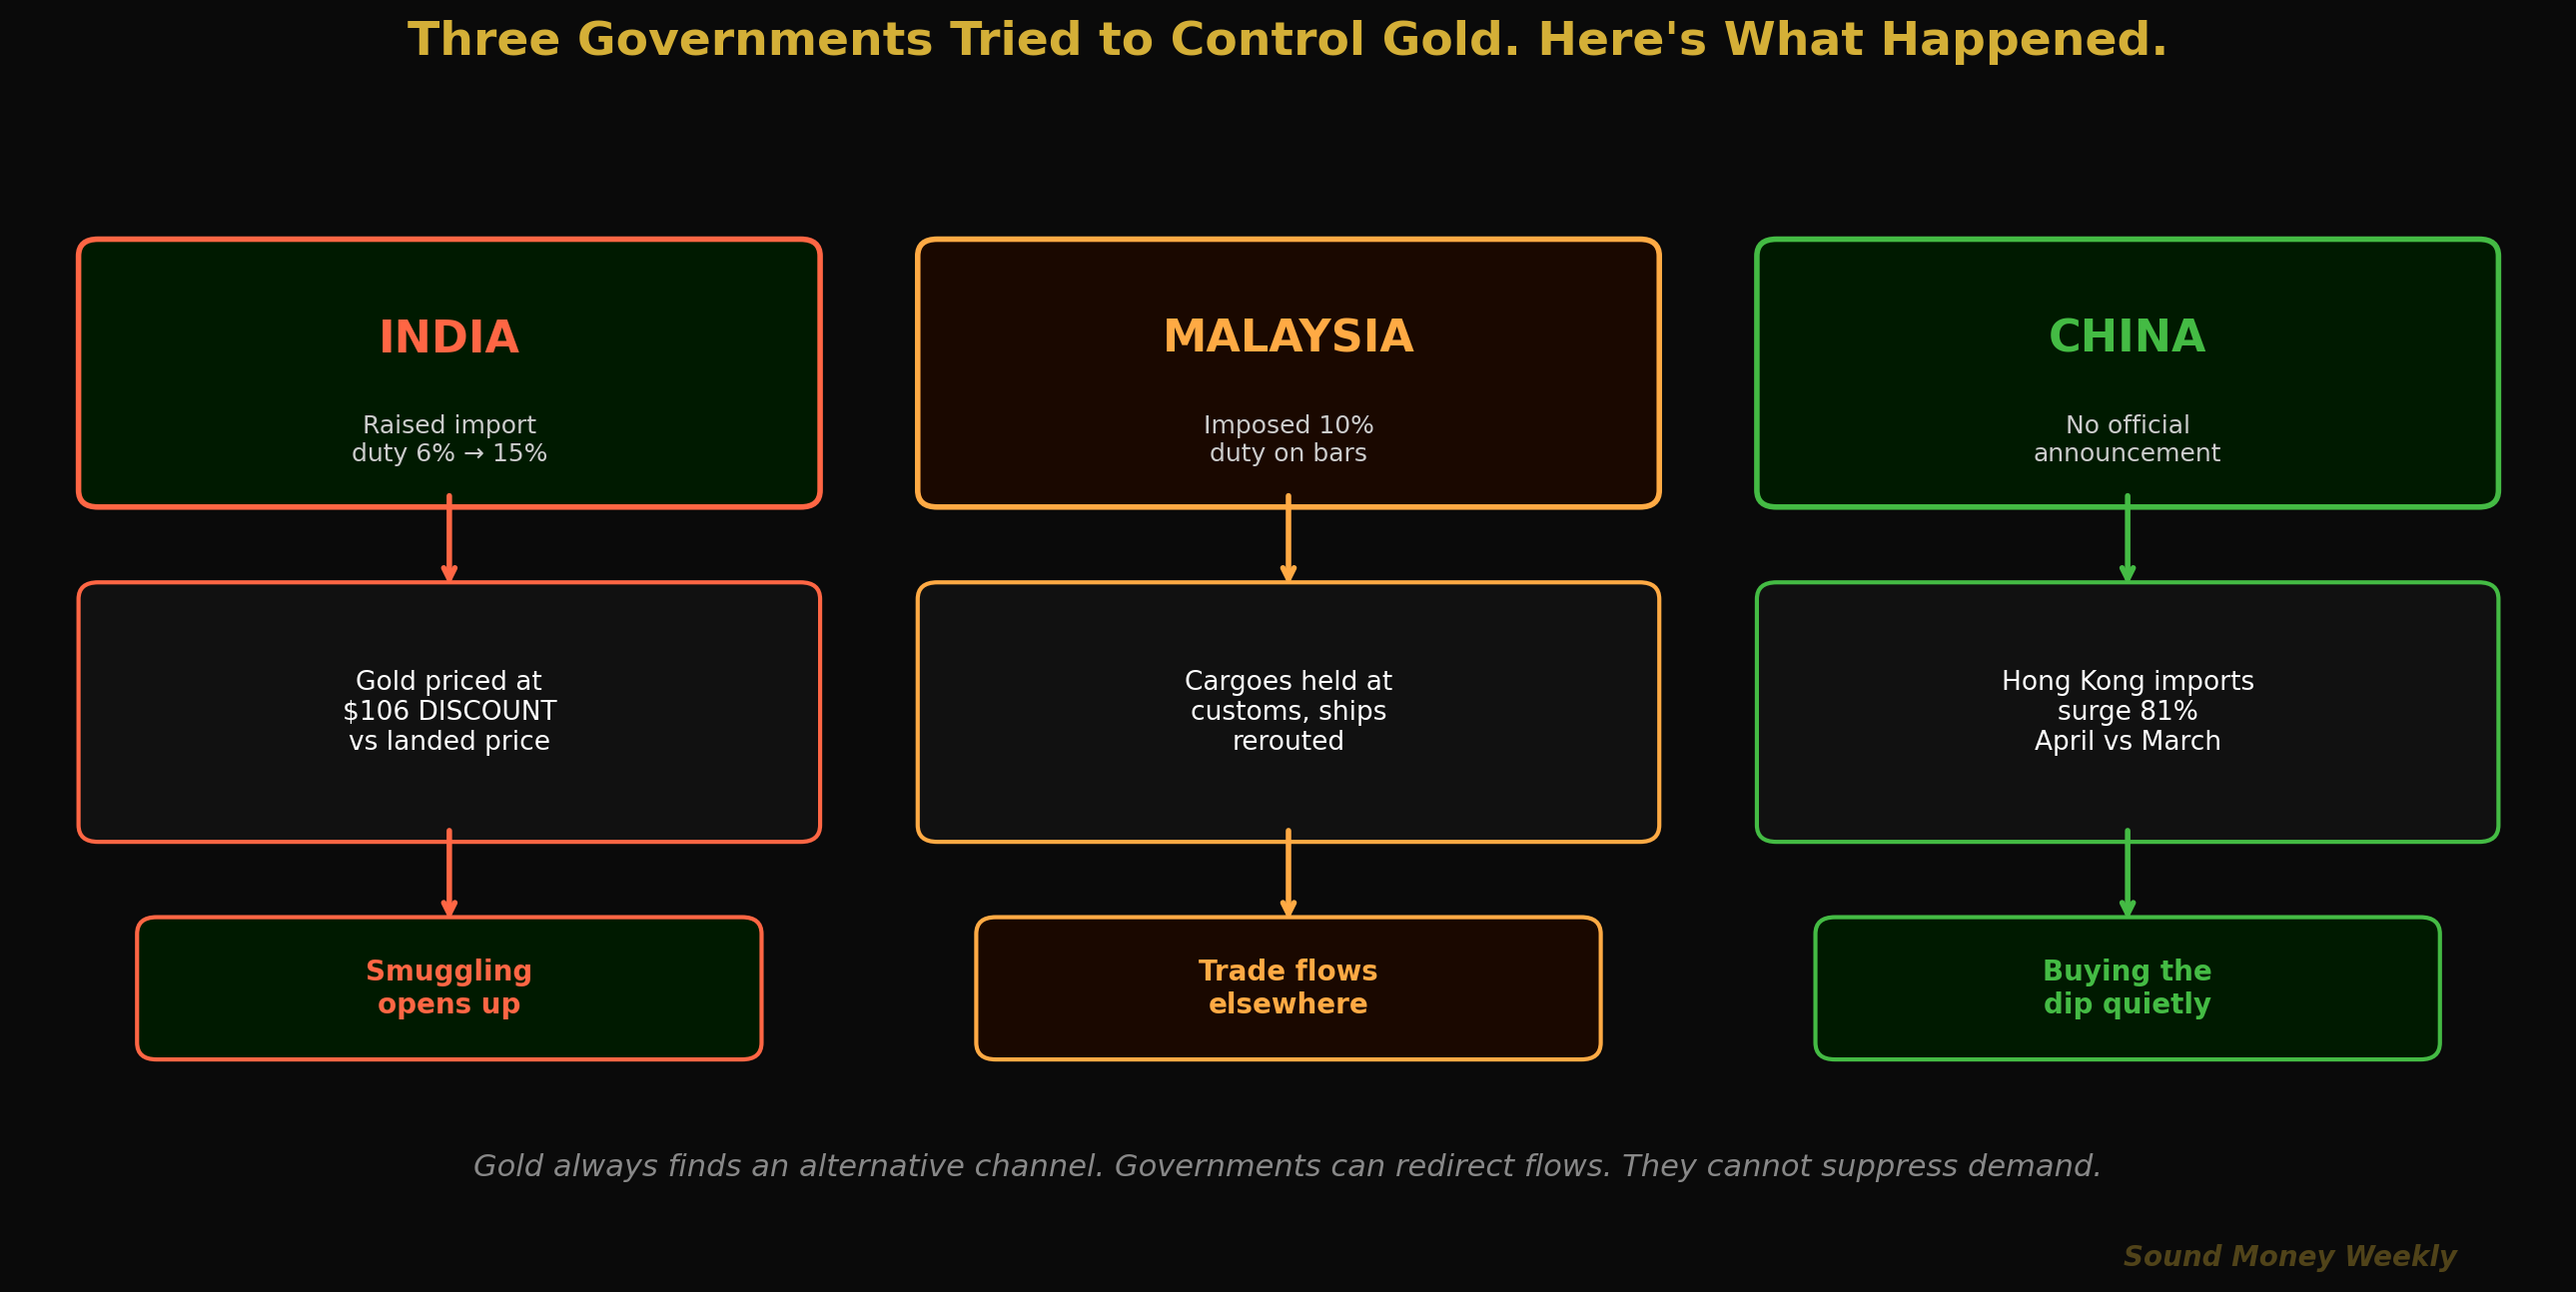
Malaysia imposed a 10% import duty on gold bar shipments. Cargoes were held at customs. Ships were rerouted.
India raised its import duty from 6% to 15% in May, and the local market responded by swinging to a discount of as much as $106/oz against the international landed price.
China issued no announcement, made no headline. Its net gold imports through Hong Kong jumped 81% from March to April.
The pattern is consistent across all three: when governments attempt to redirect gold flows, the flows find another channel. The metal does not stop moving. It finds a way.
The Market Week: Iran Hardens, Gold Holds
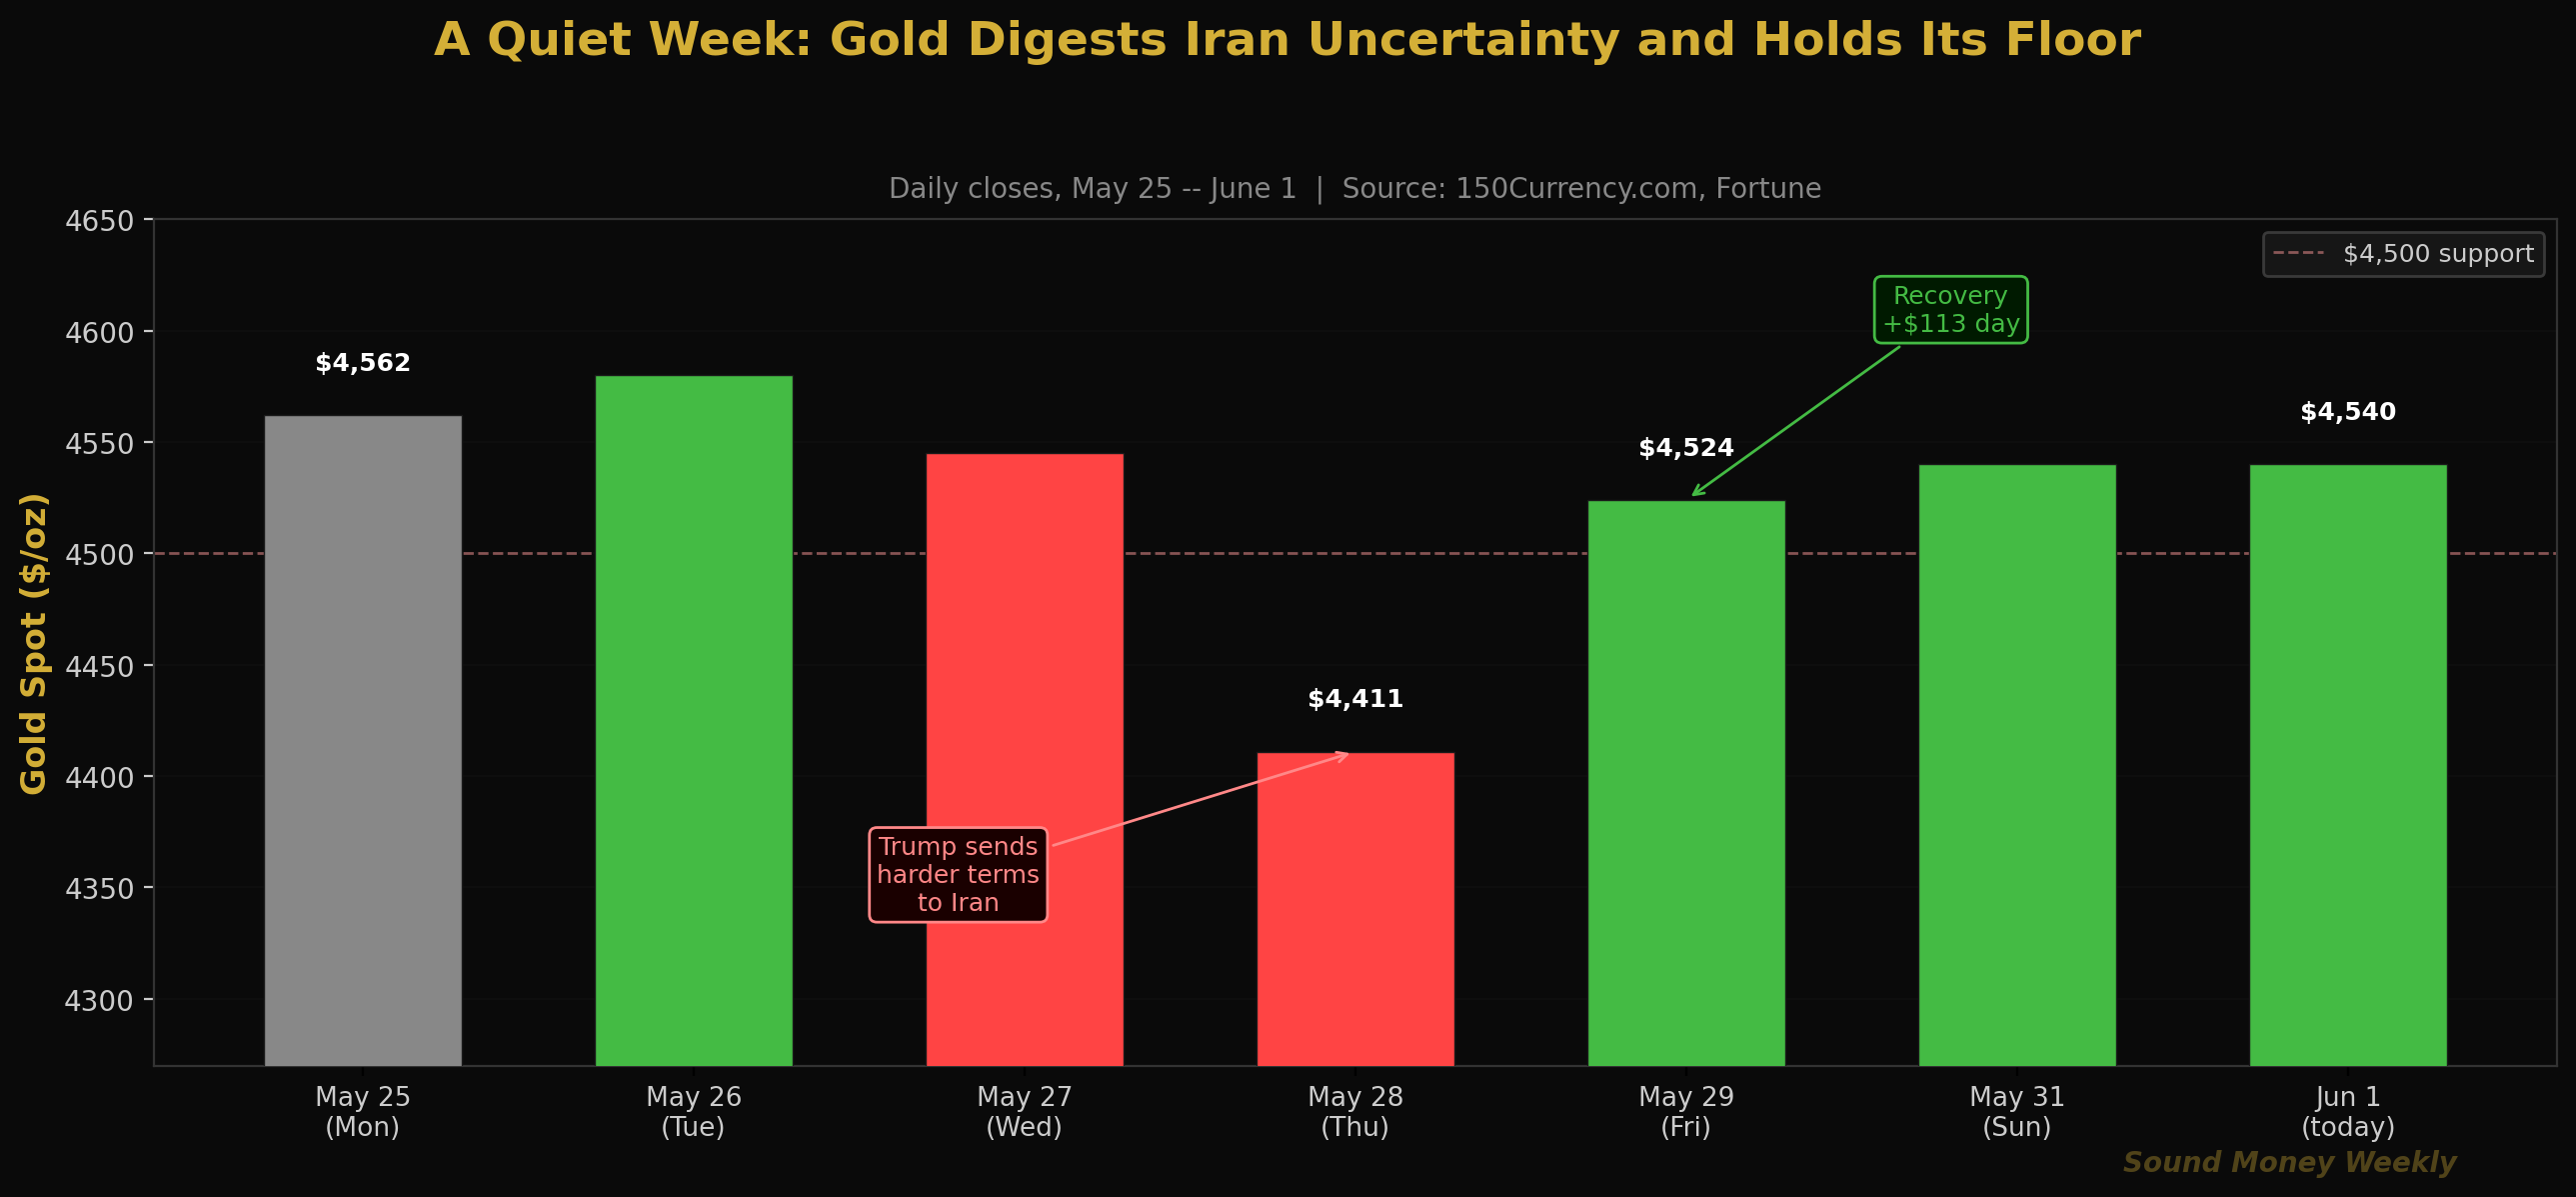
Before the Asia story, the week's market context: gold traded between $4,411 and $4,562, ending near $4,540. The Iran deal process continued but hit resistance when the Trump administration sent a revised, tougher set of terms to Tehran. Rather than the imminent Hormuz reopening markets had priced last Monday, the timeline shifted to "weeks, not days."
Gold's response was telling: a sharp intraday drop to $4,411 when talks appeared to harden, followed by a swift $113 recovery to $4,524 the following day as buyers viewed that level as overextended. By Sunday, gold had settled at $4,539. This morning it is essentially unchanged at $4,540.
This is now the third time in six weeks that gold has tested the $4,400-$4,450 range and bounced. The floor is well-established. The ceiling -- the 50-day moving average near $4,807 -- remains the next technical target whenever the macro catalysts align.
Silver at $75.20 is somewhat weaker this week, reflecting the pullback in industrial sentiment as tariff truce optimism cools slightly and Iran uncertainty lingers. The GSR sits near 60:1, still meaningfully tighter than the 66-67:1 levels seen during the March selloff.
Three Governments. Three Outcomes. One Lesson.
Malaysia: The 10% Tollbooth
Malaysia's decision to impose a 10% import duty on gold bar shipments was designed to slow capital outflows and protect the ringgit, which has been under pressure from the strong dollar. The practical effect: cargoes were held at customs while importers assessed the economics, and shipping routes began adjusting to route through jurisdictions with more favorable treatment.
This is the predictable consequence of a price control that creates a wedge between the domestic and international price of a globally fungible asset. Malaysia's gold does not disappear. It goes to Singapore, to Hong Kong, to the UAE -- markets with lower transaction costs. Malaysia's market becomes smaller; the global market continues unaffected.
The lesson for investors: government gold policies reveal the government's anxiety about their currency, not a fundamental threat to gold demand. A government does not impose a 10% gold tariff because gold is irrelevant. It does so because gold competes successfully with the local currency.
India: The $106 "Discount" That Isn't
When Indian gold dealers report a $106/oz discount against the international landed price following the import duty hike, most casual readers interpret this as weak demand. The actual dynamic is the opposite.
Here is how it works. India raised its official gold import duty from 6% to 15% in May. The landed cost of legal gold -- international price plus 15% duty plus applicable taxes -- became substantially higher than what the domestic market would pay. Result: dealers in the official channel cannot compete with unofficial imports (smuggling) that bypass the duty.
The $106 discount is the equilibrium price at which legal dealers can still move inventory while competing with illegal supply that has no duty cost. It is not evidence that Indians don't want gold. It is evidence that Indians want gold badly enough that an entire parallel supply chain has mobilized to provide it at a price point that makes the official channel uncompetitive.
India's gold demand has historically proven highly resilient to policy intervention. The Reserve Bank of India's own research has noted that significant import duty changes tend to shift demand between the official and unofficial channels rather than reduce aggregate demand. When the duty falls, official imports surge. When it rises, the premium disappears -- and unofficial channels fill the gap.
China: The 81% Import Surge Through Hong Kong
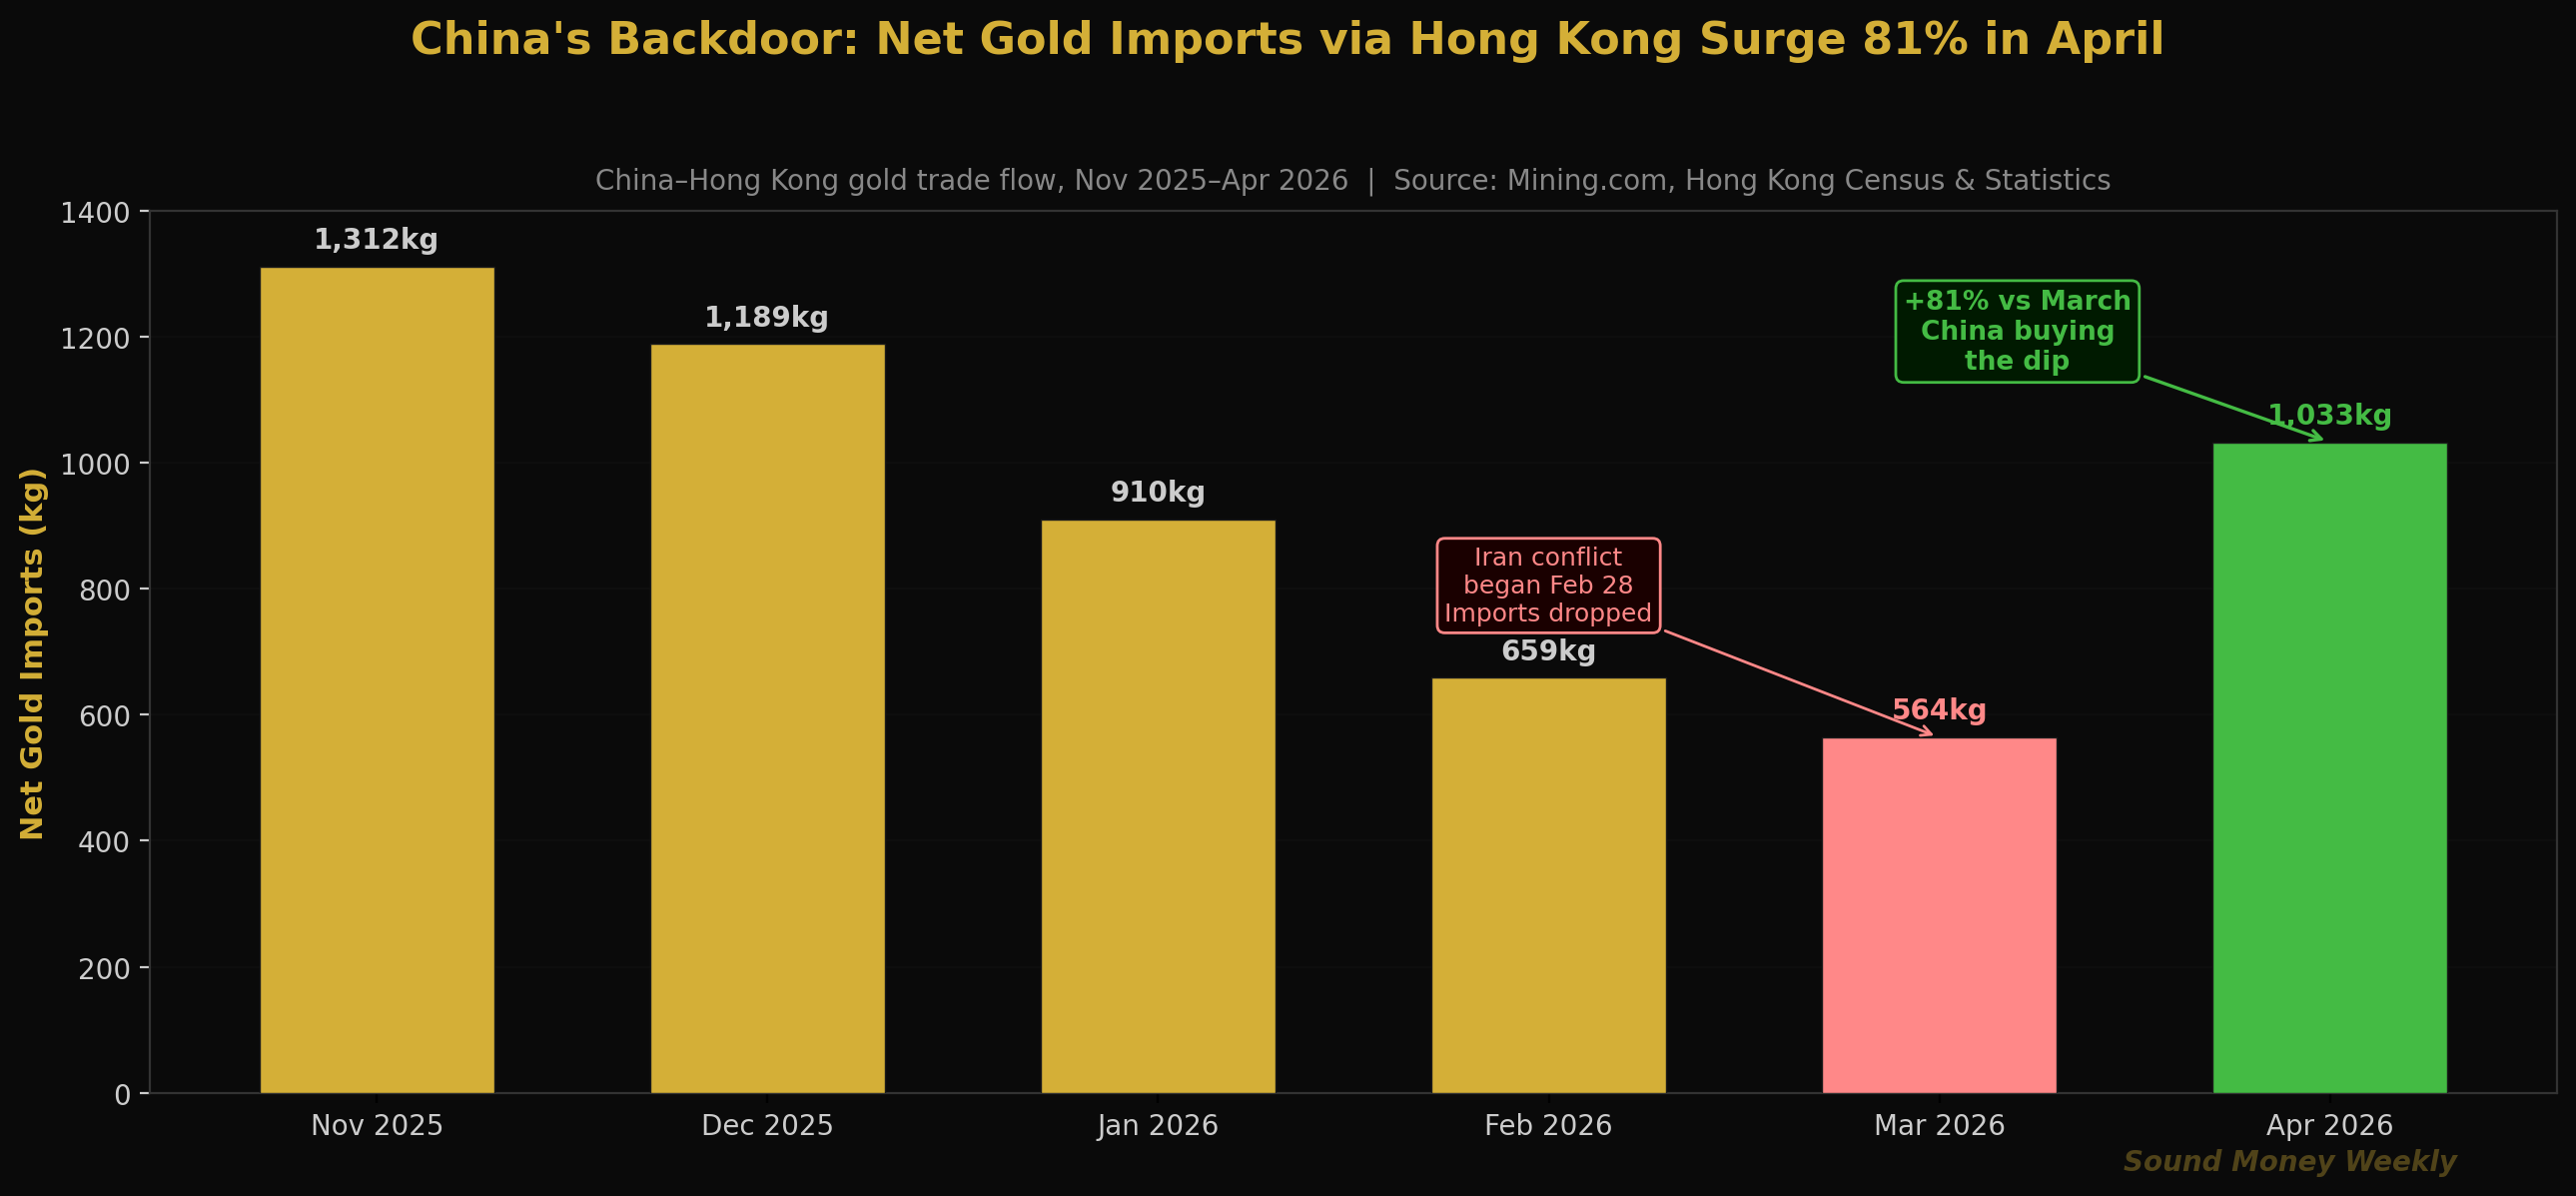
China's gold market operates through both official PBOC reserves (which are reported monthly and show a 17-month unbroken buying streak) and private commercial channels, primarily routed through Hong Kong. In April 2026, China's net gold imports through Hong Kong jumped 81% from March.
March was a notably weak month for this pipeline -- imports had dropped as the Iran conflict drove global price volatility and the March selloff discouraged buying. April's 81% surge from a depressed base reflects Chinese buyers who had been waiting for prices to stabilize resuming purchases at what they viewed as attractive levels relative to the January peak.
This is the "backdoor" in practice. When the PBOC is buying officially (17 consecutive months), it uses its own procurement channels. When Chinese commercial banks, jewelry demand, and wealth management products are absorbing gold, Hong Kong is the clearinghouse. April's surge suggests both institutional and retail Chinese demand returned once the March flash-crash low gave way to the ceasefire recovery. At $4,411-$4,562, Chinese buyers saw $1,000-per-ounce discounts from January's high. They acted.
The broader point: China's gold imports do not follow a smooth trajectory. They come in waves -- often largest when the international price offers the most attractive entry. The April 81% surge is consistent with what informed observers have described as China using periods of Western gold selling to accumulate physical at better prices. The direction is unambiguous. The timing is opportunistic.
The Structural Insight: What These Three Stories Share
The most important thing about the India, Malaysia, and China stories is not the individual data points. It is the unified pattern they reveal.
Every major government attempt to redirect gold flows in 2026 has produced the same outcome: the gold moved through a different channel, not to a different destination. Gold did not stop flowing into India after the duty hike. It flowed through unofficial channels instead. Gold did not stop trading in Malaysia after the tariff. It rerouted through Singapore and Hong Kong. China did not reduce its gold acquisition after the March selloff. It accelerated purchases through the Hong Kong pipeline.
This pattern is not new. It has been documented repeatedly across history. The London Gold Pool of the 1960s tried to keep gold at $35/oz through government coordination. It failed in 1968 when France withdrew and demand overwhelmed the intervention. India's periodic duty cycles have never produced sustained reductions in gold consumption -- only channel shifts. China's domestic gold market, officially opened only in 2002, has grown to the world's largest in two decades despite repeated regulatory attempts to influence the pace.
Gold is uniquely resistant to demand suppression because it lacks the vulnerabilities that make other assets controllable. It cannot be inflated. It cannot be defaulted on. It cannot be frozen by sanctions (the $300 billion Russian reserves lesson that every central bank has absorbed). A government can make it more expensive to acquire through official channels. It cannot make people stop wanting it.
Under the Hood: Technical View at $4,540
Gold at $4,540 is in familiar territory:
| Level | Price | Note |
|---|---|---|
| 50-Day MA (resistance) | ~$4,807 | The target; requires a catalyst to break through |
| Fib 0.382 (resistance) | $4,654 | Still overhead; reclaiming this would be constructive |
| Current | $4,540 | Third test of this zone; floor appears well-established |
| $4,411-$4,450 | Support zone | Tested this week; bounced each time |
| Fib 0.500 (major floor) | $4,361 | Has not been tested since late March |
The week's action -- a sharp dip to $4,411 on Iran deal hardening, followed by a swift $113 recovery -- is technically constructive. Markets sold the "deal delay" news and immediately bought back. That pattern (sellers losing conviction quickly) is characteristic of an oversold condition in an ongoing bull market. The floor is real.
The next scheduled catalysts: the June FOMC (June 10-11) and May CPI (June 10). If Brent crude continues its retreat from $112 toward $80-85 (the Iran deal in progress = less disruption risk), May CPI could surprise to the downside from April's 3.8%, reopening rate-cut pricing and giving gold its clearest upside catalyst since the ceasefire bounce in April.
The DCA Math at $4,540
Gold at $4,540 remains one of the more attractive entry points of 2026 relative to the January all-time high:
| Entry | Price | Oz per $200 | Annual total | Value at GS $5,400 |
|---|---|---|---|---|
| Jan ATH | $5,608 | 0.03566 oz | 0.428 oz | $2,311 |
| Today | $4,540 | 0.04405 oz | 0.529 oz | $2,856 |
| March low | $4,098 | 0.04881 oz | 0.586 oz | $3,163 |
At $4,540, consistent $200/month stacking delivers 23.5% more gold per dollar than the same program at the January high, and 0.529 ounces annually. At Goldman's $5,400 year-end target, that stack is worth $2,856 -- an 19% return on $2,400 invested. At J.P. Morgan's $6,300, it is $3,333.
The China buyers who surged 81% in April understood this calculation. They were buying gold at $4,411-$4,700 after watching it peak at $5,608. The people who have been doing exactly that -- stacking consistently through March's selloff, through April's ceasefire bounce, through May's CPI shock and Iran uncertainty -- are now holding gold at an average cost well below today's price. That is not luck. That is discipline.
The winners in this game are always in the game.
What It Means
Here is the plain-English version.
The Asia story is more structurally significant than most investors realize. China's 81% import surge, India's $106 discount, and Malaysia's rerouted cargoes are not isolated incidents. They are three simultaneous demonstrations of gold's unique resistance to policy suppression. No other major asset class exhibits this property so consistently: the demand is sovereign-resistant, the flows are geographically flexible, and the underlying conviction holds across cultures and jurisdictions that agree on almost nothing else except that gold is worth holding.
India's "discount" is a buy signal, not a sell signal. When the official market is priced above what the unofficial market will bear, it means the demand is so persistent that it has organized an alternative supply chain faster than the policy could contain it. The black market equilibrium price is not evidence of weak demand. It is evidence of demand that cannot be turned off.
China's buying pace is the most important demand signal of the year. Not the size of any individual month, but the sustained, opportunistic pattern of buying at every significant price dip. China saw $4,100 gold in March and $4,411 gold in May and bought more both times. They are not speculating. They are systematically converting dollar reserves into physical gold in a way that would have been unthinkable twenty years ago when China's gold holdings were negligible.
The floor at $4,400-$4,540 is becoming well-tested. Three visits, three recoveries. This is not yet confirmation -- one more test could be different -- but the pattern of rapid recoveries from dips to this zone suggests institutional support is present and consistent. The ceiling ($4,807, 50-day MA) is the question.
This is not a recommendation. We observe, report, and analyze. The data shows that three of the world's largest gold markets found ways to acquire more gold when their governments tried to make it harder. That is not a coincidence. It is the operating logic of a metal that has served as the world's most reliable store of value for 5,000 years. The policy interventions reveal the governments' anxiety. The market's response reveals what people actually believe about the future of paper money.
What We're Watching
June FOMC (June 10-11) and May CPI (June 10). These are the week's most important scheduled catalysts. If oil has continued its retreat from $112 toward $80-85, May CPI should be meaningfully lower than April's 3.8%. A CPI below 2.5% would revive rate-cut discussions and give gold its clearest near-term catalyst. Warsh's tone at the press conference will set expectations for H2 2026 rate path.
The Iran deal timeline. Trump's tougher terms sent to Tehran represent a negotiating posture, not a breakdown. The Islamabad channel remains open; Pakistan and Turkey are still mediating. Watch for any Iranian counter-proposal that could revive deal momentum quickly. A reopening of Hormuz is still the single largest potential positive catalyst for gold this year.
India's demand data over the next 30-60 days. The $106 discount cannot persist indefinitely. Either the official import duty gets reduced (if the government reads the smuggling signals as a policy failure) or the official market recovers as prices adjust. Either outcome has implications for the global supply/demand balance.
China's May Hong Kong import data (published in approximately six weeks). If May continues April's surge, it confirms a sustained dip-buying trend from the world's largest gold market. If May normalizes, the April surge was a one-month catch-up.
The $4,807 level. Every week gold stays in the $4,400-$4,600 range without breaking lower, the 50-day MA gets closer to coming down to meet it. Eventually, either a catalyst pushes gold through $4,807 from below, or the MA descends to current levels and acts as resistance from the side. The June catalysts could determine which.
Until Next Week
In the spring of 1968, the London Gold Pool collapsed. Eight countries had tried for seven years to hold gold at $35 per ounce by coordinating sales from their reserves whenever demand pushed the price higher. In March 1968, France withdrew. Within two weeks, the pool was dissolved and gold was free to find its market price.
It went from $35 to $180 in under four years.
The lesson from 1968 is the same as the lesson from Malaysia, India, and China in 2026: governments can tax gold, discount it, restrict it, and regulate it. They cannot suppress the demand for it. Every intervention eventually reveals the limits of the policy and the persistence of the underlying conviction.
At $4,540, gold is trading 19% below an all-time high set just five months ago. Three of the world's largest gold markets -- representing 3.5 billion people -- are buying, smuggling, and routing around government policy to acquire more of it. Central banks are net buyers for the 18th consecutive year. The structural deficit in silver is in its sixth year.
The question is not whether the floor holds. It is holding. The question is what happens when the next catalyst -- CPI cooling, Hormuz reopening, Warsh's first signal -- pushes gold back through $4,807 and toward the targets that every major bank has maintained through this entire correction.
At $4,540, consistent stackers are positioned for that move. At $4,540 per ounce, you are buying the same gold that J.P. Morgan targets at $6,300 and Goldman targets at $5,400. The window between those two numbers is where the thesis plays out. The people already in the game will capture it.
The winners in this game are always in the game. See you next Monday.
Sound Money offers fractional gold and silver ownership at whole-ounce pricing -- no minimums, no premiums. Learn more at sound.money.
Disclaimer: This content is provided by Sound Money for educational and informational purposes only. Nothing published here constitutes investment advice, financial advice, trading advice, or any other form of professional advice. Sound Money is not a registered investment advisor, broker-dealer, or financial planner. The information presented reflects our analysis of publicly available data and should not be relied upon as a basis for investment decisions. Precious metals investments carry risk, including the potential loss of principal. Past performance does not guarantee future results. Always consult a qualified financial advisor before making investment decisions. For more information, visit sound.money.
- gold
- silver
- precious-metals
- china
- india
- malaysia
- hong-kong
- central-banks
- weekly-update