Paper Gold Broke $4,000. Physical Buyers Didn't Blink.
There are two gold markets. The paper market — futures, ETFs, derivatives — moves on rate expectations, dollar strength, and momentum. The physical market — bars going into vaults, contracts being stood for delivery — moves on something else entirely: the conviction of people who want actual metal, not a settlement price.
This week, those two markets sent contradictory signals. The paper market broke $4,000 for the first time since November 2025. The physical market responded by booking its highest monthly delivery figure of the year.
Understanding which signal matters more for where gold goes next is what this week is really about.
What Happened: Paper's Worst Week Since March
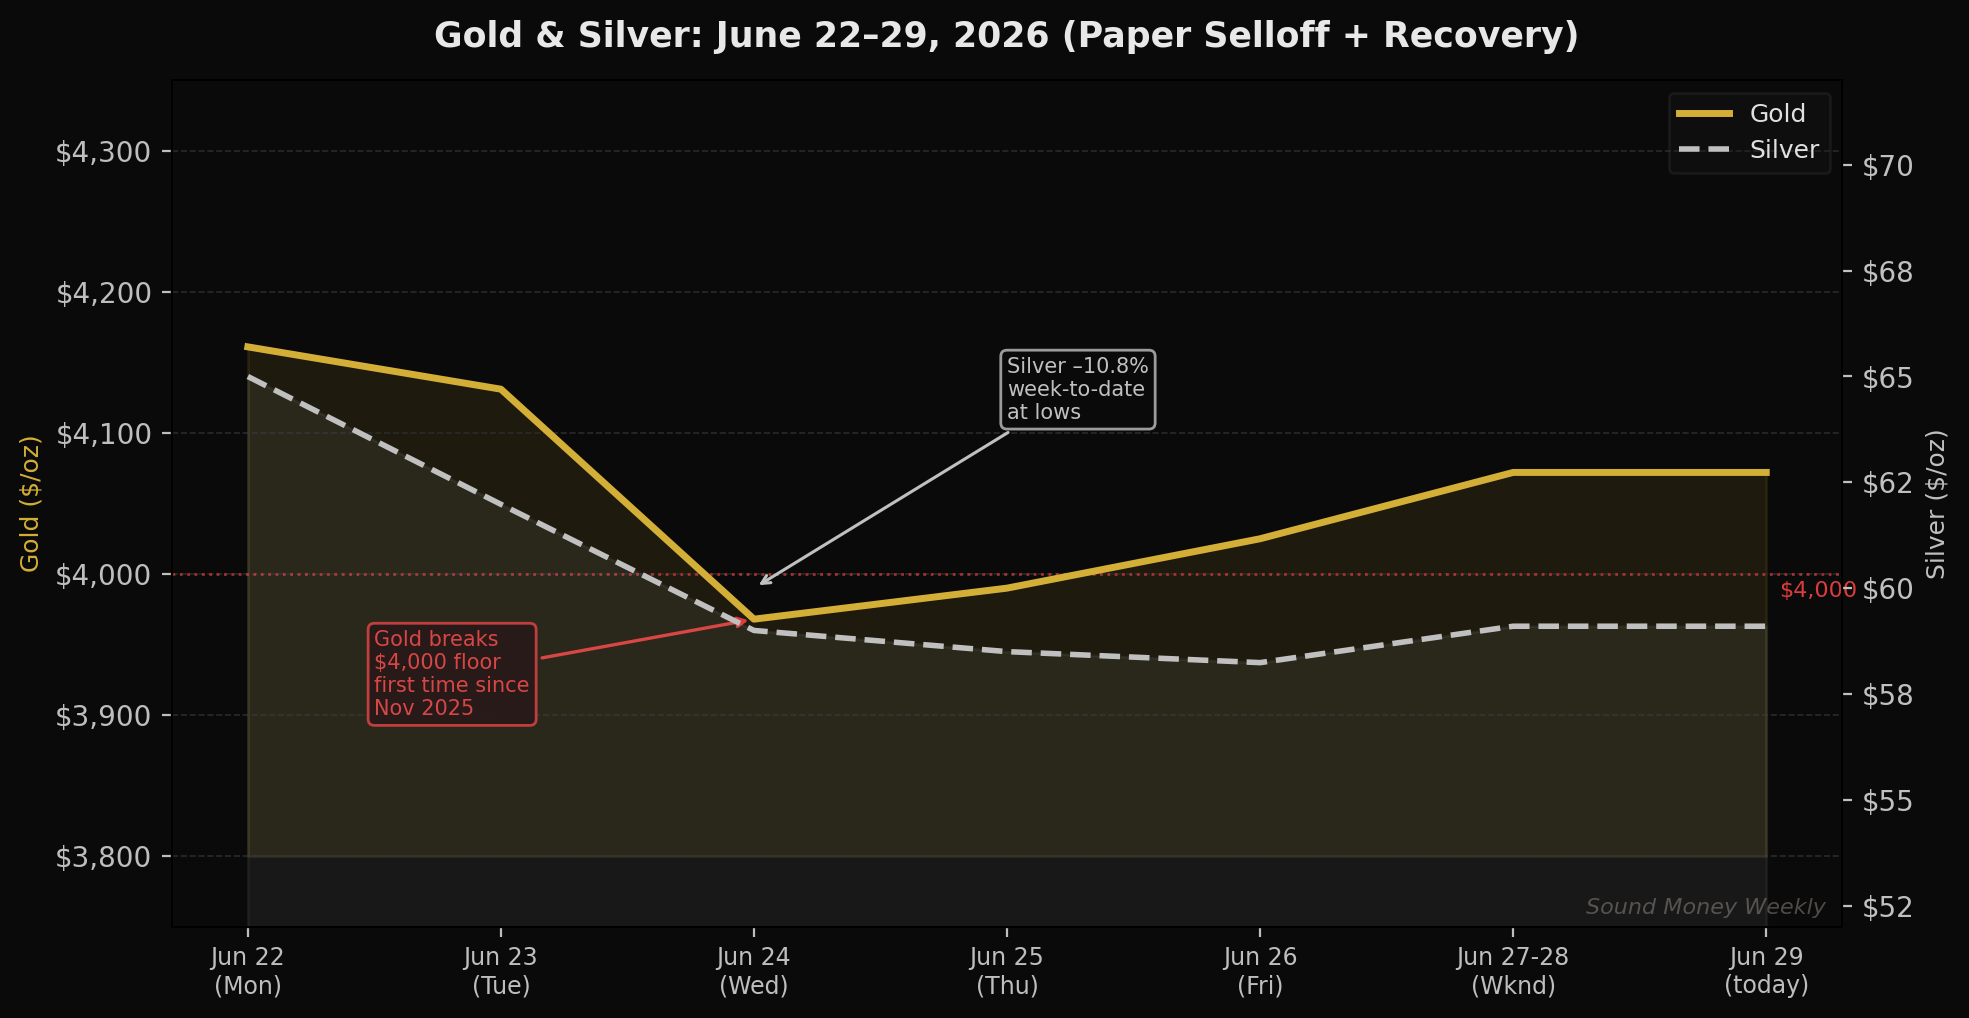
Gold entered this week at $4,161, still digesting last week's Warsh FOMC shock. By Wednesday, spot gold touched $3,968 — its lowest print since November 2025, breaking the $4,000 psychological floor that had been a line in the sand for bulls. COMEX futures settled Wednesday at $3,990.30, down 3.38% on the session.
The drivers were the same forces that have been building since Warsh's hawkish FOMC debut: a stronger dollar, rising Treasury yields, and a rate-hike expectation that now sits at 87% probability for December. Every strong economic data point validates that narrative. Every data point that supports hikes sends gold lower in the short term — mechanically.
By Friday, gold had recovered to around $4,025. Today, Monday, it is trading at approximately $4,072 — still down $89 from last Monday but well off the Wednesday lows.
Silver took a harder hit. From $65 at the start of last week, silver fell to approximately $57.47 at its low — a decline of more than 11% in four trading days before partially recovering to ~$59 by the weekend.
Wall Street Walking Back Its Calls
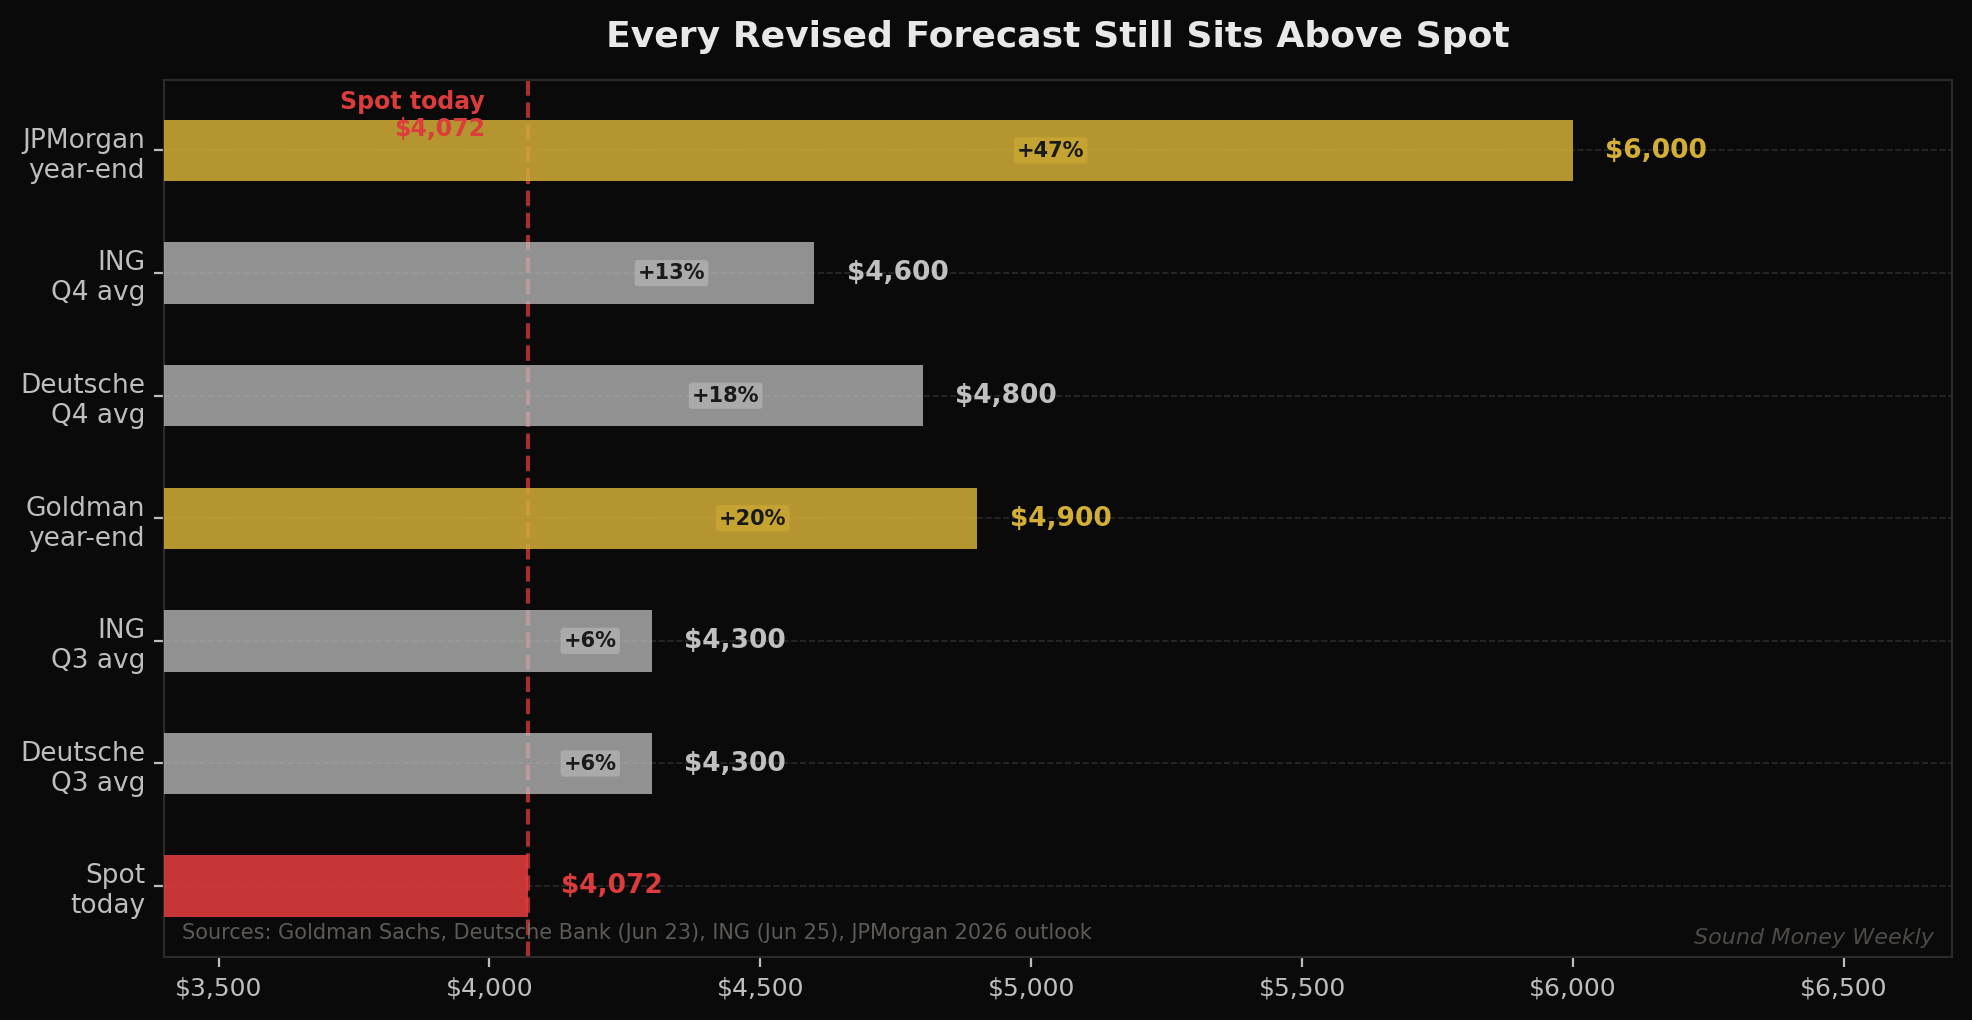
The selloff prompted a wave of forecast revisions that made headlines. Deutsche Bank cut its Q3 2026 average gold price forecast by more than 22%, to $4,300, with Q4 now at $4,800. ING similarly moved to $4,300 for Q3 and $4,600 for Q4. Goldman's year-end target of $4,900 (already revised down last week from $5,400) remains on the table; in a more aggressive hike scenario, they've flagged $3,800 as a tail risk.
Here is the thing worth noticing in all those revisions: every single revised target still sits above today's spot price. Deutsche's bear Q3 call is $4,300 — $228 above where gold is trading right now. The institutions cutting their forecasts are not calling for $3,500 gold. They're recalibrating around a $4,300-$4,900 band. That is not a bearish consensus. That is a compressed bull case.
The Physical Signal Nobody Is Talking About
Here is the part of the story the headlines missed.
While paper gold futures were being sold down through $4,000, COMEX — the physical delivery mechanism underneath the futures market — was booking its highest monthly gold delivery figure of 2026: approximately 127 tonnes.
To stand for COMEX delivery, you don't sell your futures contract for cash. You take the gold. You arrange to accept actual metal — 100 troy ounce bars, assayed and stamped — into a registered vault. That is a fundamentally different act than trading paper. It is a statement: I want the metal, not the settlement.
June 2026 saw the most entities making that statement, at the highest aggregate tonnage, of any month this year. That happened while spot price was printing $3,968.
The entities taking delivery are not retail investors. They are institutions with the operational infrastructure to accept, vault, and carry physical gold. Some of them are likely the same central banks whose buying intentions the WGC survey captured at record levels last week. When institutional-scale physical demand accelerates into a paper selloff, that is not typical behavior. Typically, when prices fall, delivery intent falls with it. The divergence here is the signal.
Under the Hood: Silver's Counterintuitive Math
Silver's selloff this week — from $65 to ~$57 at its low — deserves its own analysis, because the medium-term story for silver is developing in a way that doesn't fit the simple narrative.
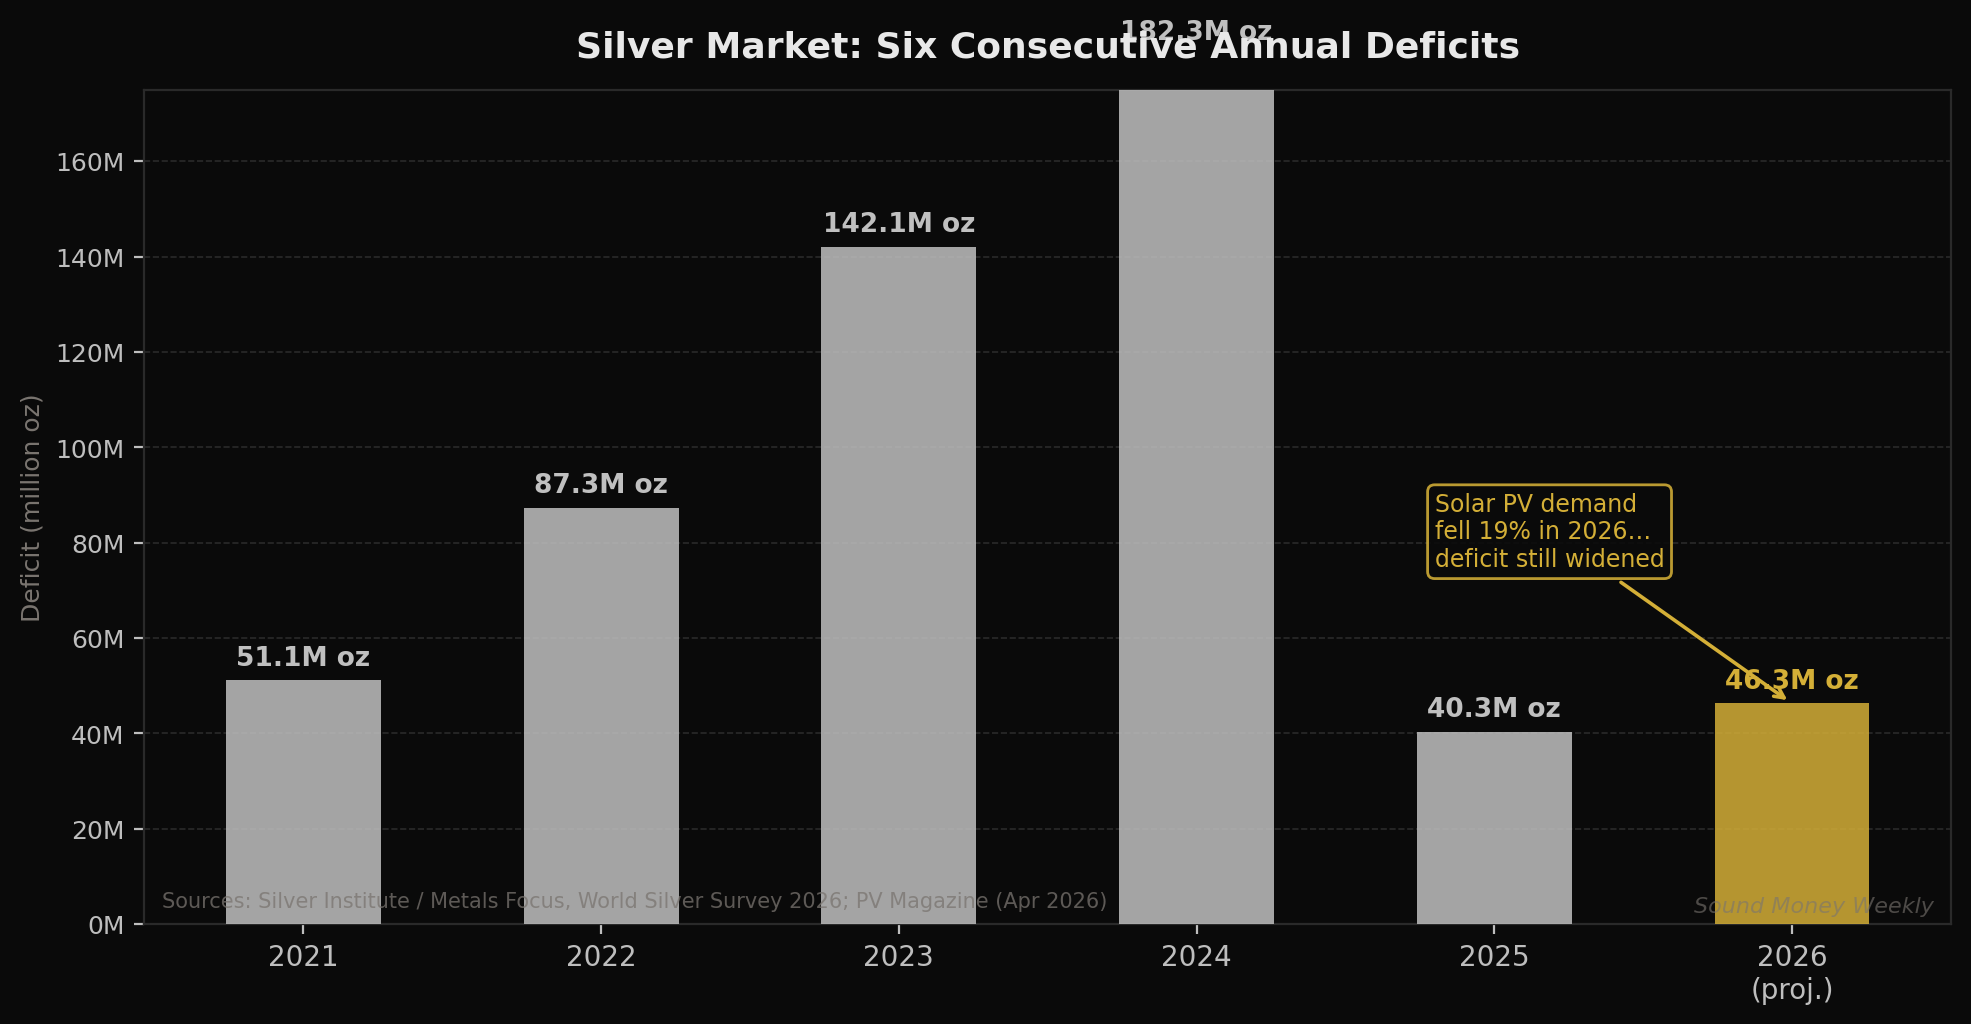
Most people would expect that if solar panels are using less silver, silver's demand-supply picture should improve. In 2026, solar PV manufacturers reduced silver loading per cell — a process called thrifting — cutting solar silver demand by approximately 19%, from 186.6 million ounces in 2025 to around 151 million ounces in 2026.
Yet the 2026 silver deficit is projected to widen to 46.3 million ounces — up from 40.3 million ounces in 2025. Solar used less silver. The shortfall got bigger.
The reason is supply. Approximately three-quarters of silver production is a byproduct of copper, zinc, and lead mining. When base metal prices fell sharply in H1 2026, mine operators cut production — and silver output fell with it. The result: even with solar thrifting reducing industrial demand, the overall supply decline outpaced the demand reduction, and the market deficit widened.
This is silver's sixth consecutive annual deficit. The structural dynamic — supply locked to base metals, demand driven by electrification and industrial applications that don't disappear because spot price fell this week — doesn't resolve on a short timeline. The selloff is a rate-and-dollar story, not a silver-fundamental story.
What It Means for the DCA Investor
Let's be direct about the headwinds first. Warsh's hawkish turn is real. Rate-hike expectations at 87% for December are real. A stronger dollar is a genuine mechanical headwind for dollar-priced gold. If the Fed hikes in September, gold will likely face more pressure before it stabilizes.
The question is not whether those headwinds exist — they clearly do — but whether you can identify a price level at which the structural demand case overrides the cyclical rate case. The COMEX delivery data suggests that some of the world's largest institutional gold buyers have answered that question for themselves, and their answer was: at $3,968, we take delivery.
The DCA math at $4,072:
Every $200 monthly contribution today buys 0.04912 oz of gold.
- In January, at the all-time high of $5,608, that same $200 bought 0.03566 oz
- Today you are getting 37.7% more metal for the same dollar contribution than at the ATH
- Over 12 months at $200/month: you accumulate 0.5895 oz
- Total invested: $2,400
- At Goldman's revised year-end target of $4,900: your position is worth $2,888 — a return of +20.3%
- At Deutsche Bank's Q4 average of $4,800: worth $2,830 — still +17.9%
The math is straightforward. The institutions that just took 127 tonnes of physical delivery at $3,968 understand something fundamental: the paper price and the metal are not the same thing, and when they diverge, the metal eventually wins.
What We're Watching
June CPI — Due Mid-July
This is the most critical near-term data point. If June CPI comes in soft — say, 3.8% or lower, reversing May's 4.2% acceleration — the rate-hike probability for December drops sharply and gold's primary headwind moderates significantly. If June CPI matches or exceeds May, Warsh's September hike becomes near-certain and gold stays under pressure.
$4,000 as a Technical Magnet
Gold bounced from $3,968 to $4,072 in two trading days. The $4,000 level will remain contested. Every technical sell signal that was triggered by the break below $4,000 has now technically reversed. The floor is being re-tested from the other side.
Silver at $57–$59: GSR Widening
The gold-to-silver ratio has moved from approximately 60:1 (June 22) to approximately 69:1 today. Historically, GSR above 65 has preceded silver outperformance relative to gold in the subsequent 6-12 months. This is not a short-term call. But for accumulation purposes, silver at $57-59 buys the widest GSR spread since early 2026 — meaning you're getting relatively more silver per dollar vs. gold than at almost any point this year.
COMEX July Delivery Intent
Watch whether July delivery intent maintains its elevated pace. If physical delivery continues to run at the June level or higher while spot price stays suppressed, the paper-vs.-physical divergence intensifies further.
The Bottom Line
Paper gold broke $4,000 this week. It also recovered above $4,000 within two trading sessions. The $3,968 print was real, but so was the institutional physical buying that showed up to meet it with 127 tonnes of COMEX delivery intent.
Goldman, Deutsche Bank, and ING have all revised their forecasts lower in the last two weeks. Not one of them has revised to a target below $4,300 for the remainder of 2026. The bear cases are bear cases for the ceiling, not the floor.
Silver ran its sixth consecutive annual deficit in a year when its biggest industrial customer used 19% less of it. The supply side wrote the story this year, not the demand side. A spot price that's down 11% in a week doesn't change a six-year structural deficit dynamic.
At $4,072 gold and $59 silver, you are buying more metal per dollar than at any point since October 2025. The people who just took 127 tonnes of physical delivery made their position clear. Monthly contributions put you in the same trade, one dollar-cost-averaged ounce at a time.
This article is for informational purposes only and does not constitute investment advice. Past performance of gold and silver prices is not indicative of future results. Always conduct your own research and consult a qualified financial advisor before making investment decisions. Sound Money provides fractional precious metals ownership services — see sound.money for full terms and conditions.
- gold
- silver
- precious-metals
- comex
- physical-gold
- dollar-cost-averaging
- silver-deficit
- fed-rate-hike