The Fed Hiked to 4%. Unanimously. Gold Rallied 2% the Next Day.
The Fed's first rate hike since 2023: unanimous 25bps to 3.75–4%. Gold dipped, then surged 2%. Silver added 8% in two sessions. December hike expected.
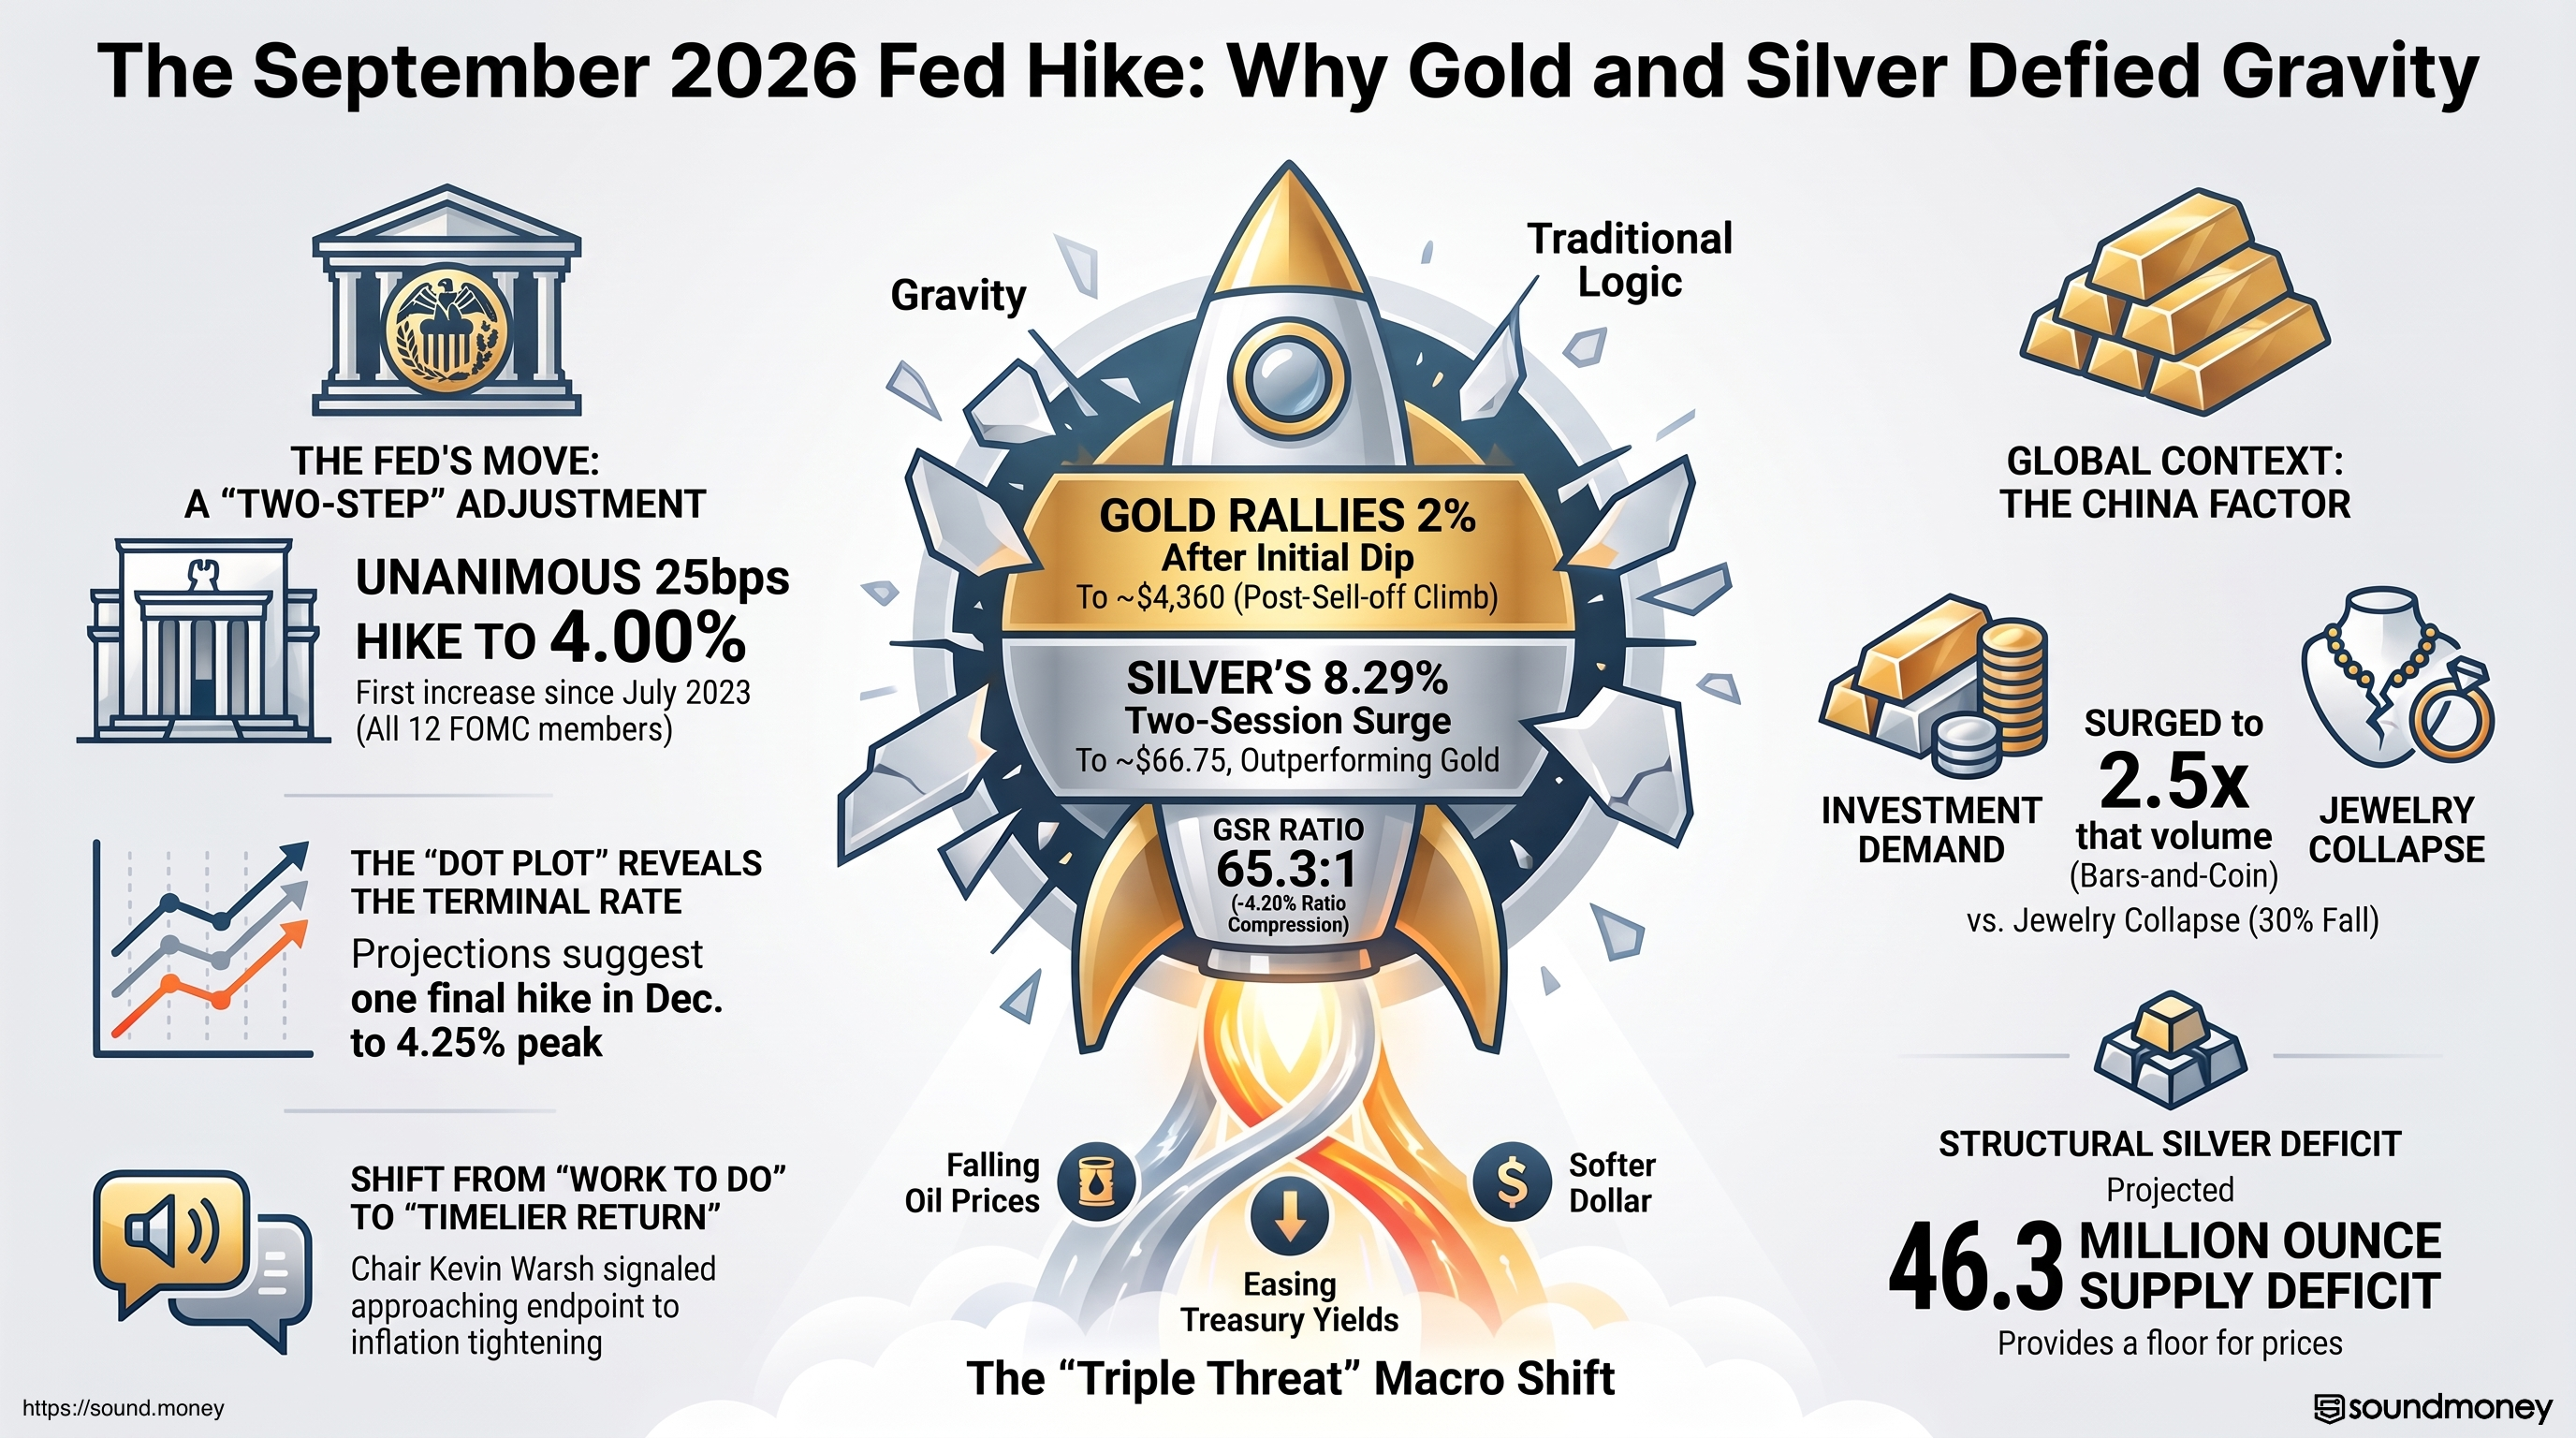
The decision everyone was waiting for arrived Wednesday afternoon, and it landed almost exactly as the 83% probability suggested it would. The Federal Reserve voted unanimously to raise the target range for the federal funds rate by 25 basis points, bringing it to 3.75%–4.00% — the first rate increase since July 2023, and the first policy action taken by Chair Kevin Warsh since he stepped into the role.
And then something interesting happened.
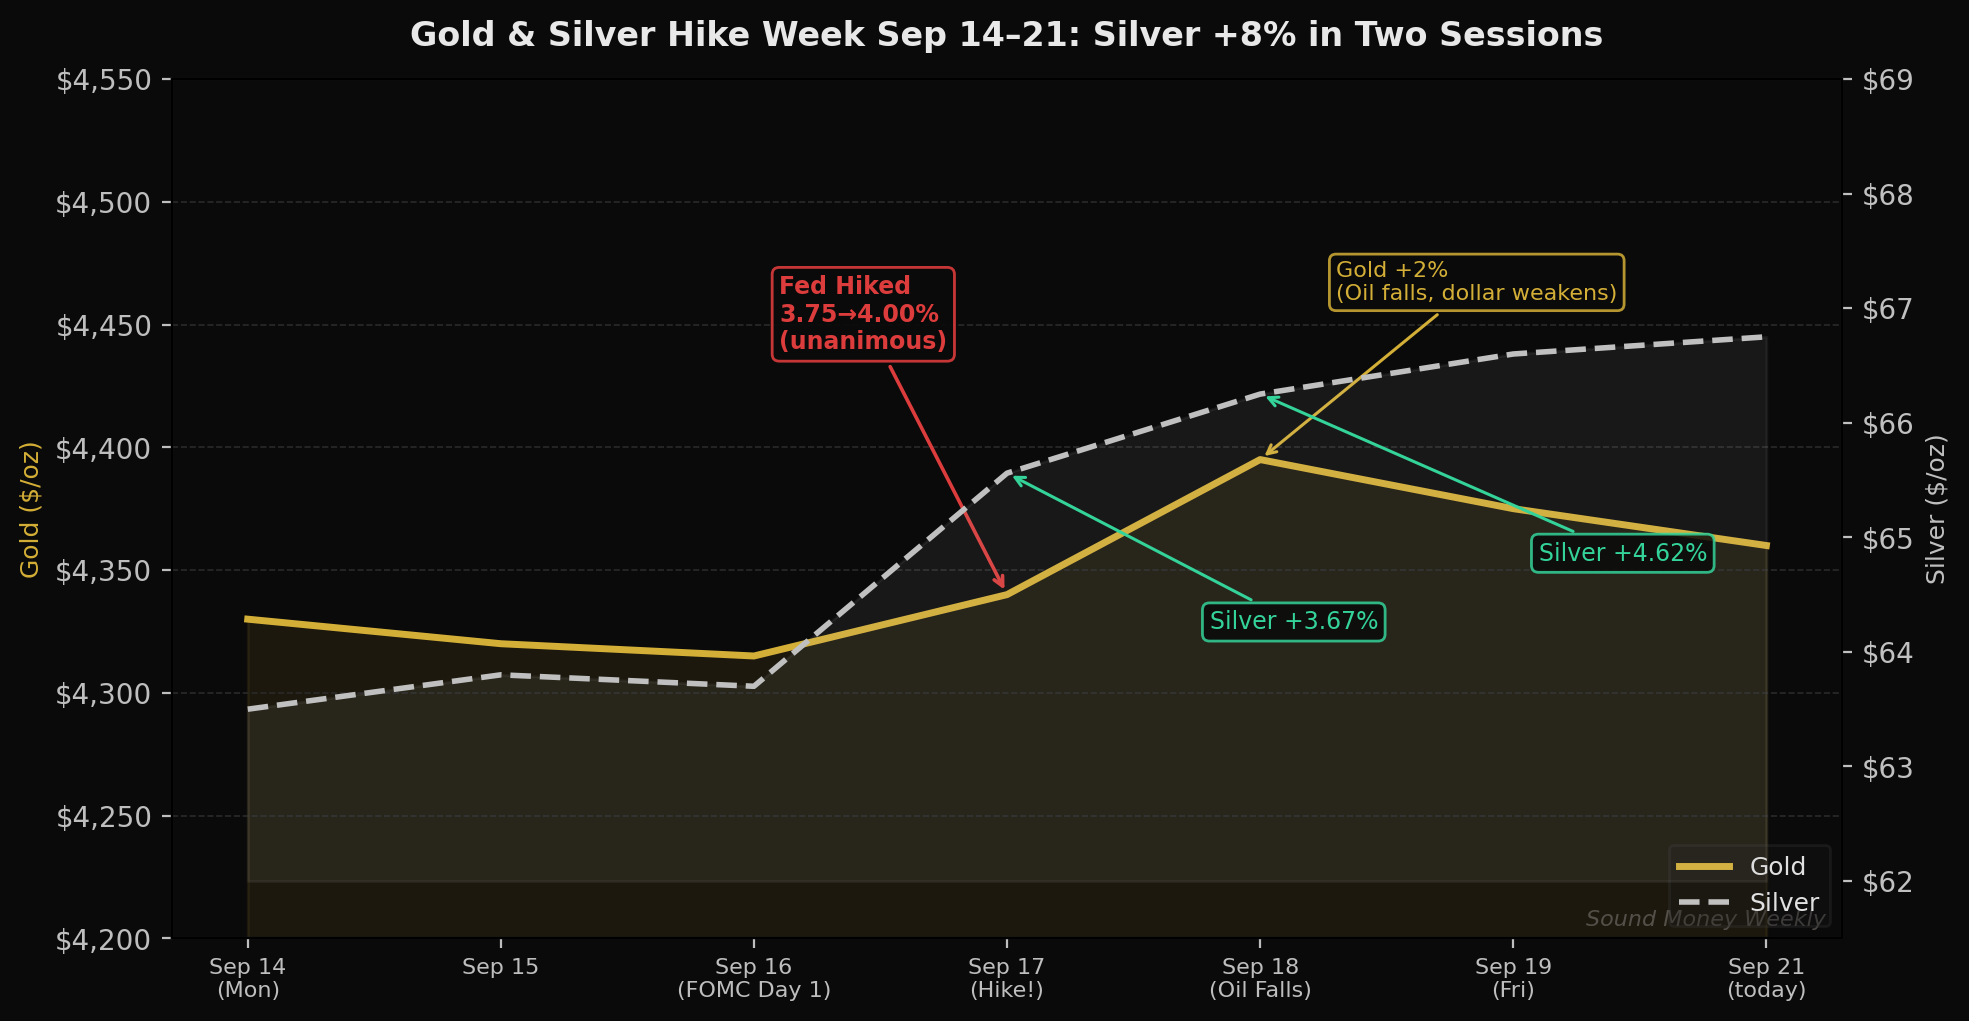
Gold dipped. Silver jumped 3.67%. And then, on Thursday, as oil prices fell and Treasury yields eased, gold gained more than 2% — and silver added another 4.62%.
By this morning, gold is at approximately $4,360 and silver at $66.75. The hike happened. The metals shrugged and moved higher.
The September FOMC: What Warsh Did and Said
The vote was unanimous. All 12 voting members of the Federal Open Market Committee supported the 25-basis-point increase — a notable contrast to prior meetings where three dissenters pushed back against holding rates. When Warsh decided to hike, there was no internal resistance.
The messaging was more measured than Jackson Hole. Where Warsh's August speech had used the phrase "work to do," Wednesday's press conference centered on a "timelier return to 2% inflation." The framing matters: "work to do" implies an extended process; "timelier return" implies an endpoint that exists and is approaching. Gold read the difference.
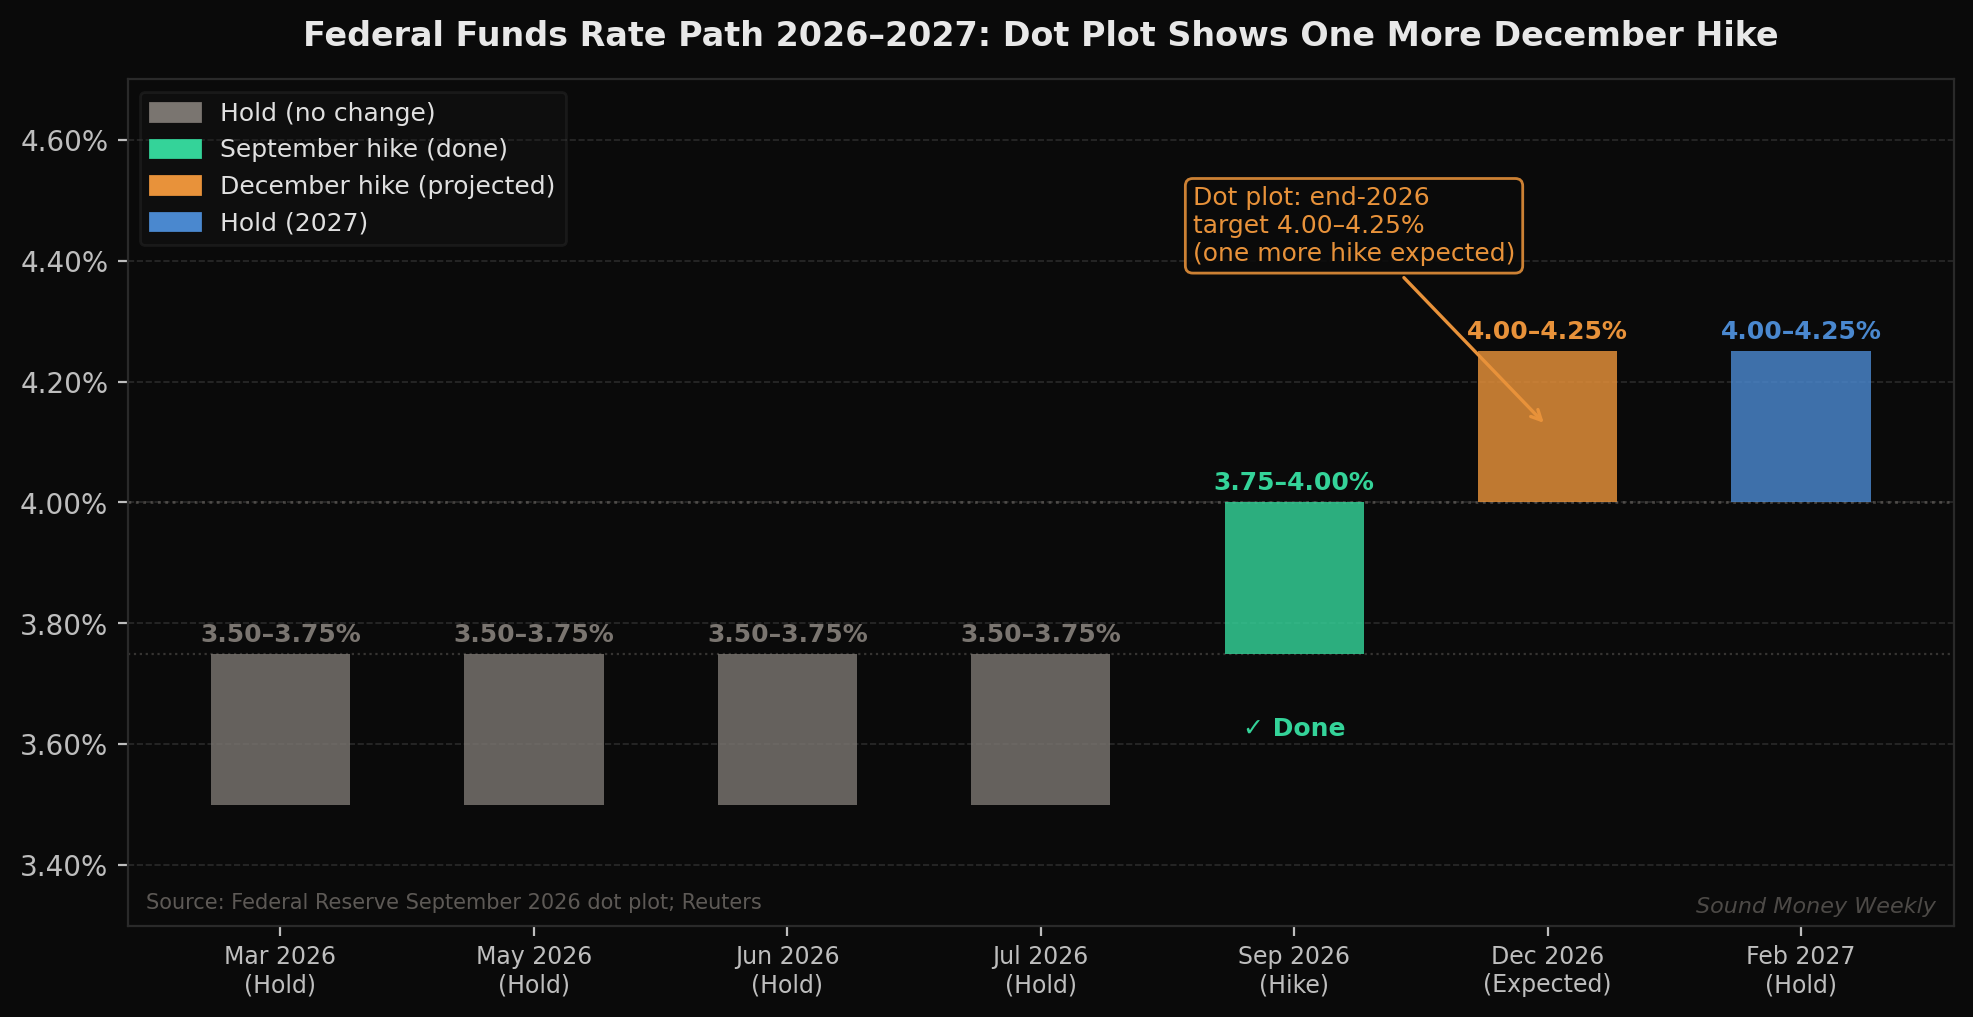
The dot plot was the most important disclosure in the package: new projections show the policy rate reaching 4.00%–4.25% by end of 2026 and holding there through 2027. One more 25-basis-point hike — most likely at the December 15-16 FOMC — and then a pause. Not a hiking cycle. A two-step adjustment.
Lord Abbett's assessment captured the market read: "We do not view this as the start of an extended hiking cycle."
That's the framework gold priced in Thursday.
Why Gold Rallied After a Rate Hike
The standard narrative says rising rates hurt gold — higher yields raise the opportunity cost of holding a non-yielding asset, and a stronger dollar makes gold more expensive globally. On Wednesday afternoon, as the hike landed, that narrative briefly played out: gold dipped to around $4,306 in the immediate aftermath.
Then Thursday happened.
Three things broke the standard narrative simultaneously. Crude oil prices fell sharply — lower oil prices reduce the inflation inputs that had been driving rate expectations. The 10-year Treasury yield pulled back as traders concluded the dot plot's terminal rate (4.25%) was clear and near. And the dollar softened. All three inputs are negative for gold's opportunity cost — and when they move together, gold moves.
The deeper dynamic is how thoroughly the September hike had been priced. At 83% probability, Wednesday's decision was already fully embedded in gold's $4,330 Monday price. The "sell the news" lasted roughly 90 minutes before the market recognized there was nothing left to sell.
What gold is now pricing is the December decision — and at 4.25% as the dot plot's terminal, the post-December path points toward the eventual cuts that have historically been among gold's strongest catalysts.
Silver's Two-Session Surge
Silver's week deserves its own paragraph. Starting from $63.50 Monday morning, silver gained 3.67% on the hike day itself — to $65.56 — and then added another 4.62% on Thursday as oil fell and the macro backdrop shifted. Two sessions: +8.29% in peak moves from the Wednesday open.
The current spot price of approximately $66.75 puts the week-over-week gain at roughly 5%, and the gold-to-silver ratio has compressed from last week's 68.2:1 to approximately 65.3:1. That compression — silver outperforming gold — often signals silver catching up to gold's established gains, which is what tends to happen in the later phases of a precious metals rally cycle.
Silver's structural supply deficit (46.3 million ounces projected for 2026, per Reuters) provides the underpinning. Rate-hike pressure was the headwind. When the headwind shifted for 48 hours, silver moved with the velocity of a market that had been held back.
Worth noting: those 8% two-day moves happened in a market that CME now keeps open 24 hours a day, 7 days a week. Weekend participation, Asian buyers, always-online investors — they all contributed to silver's price discovery in real time. That's a structural change in who sets silver's price and when.
China: The Boom Isn't Where You Think It Is
China's gold story in 2026 has a twist that's easy to miss if you're only reading the headlines about elevated demand.
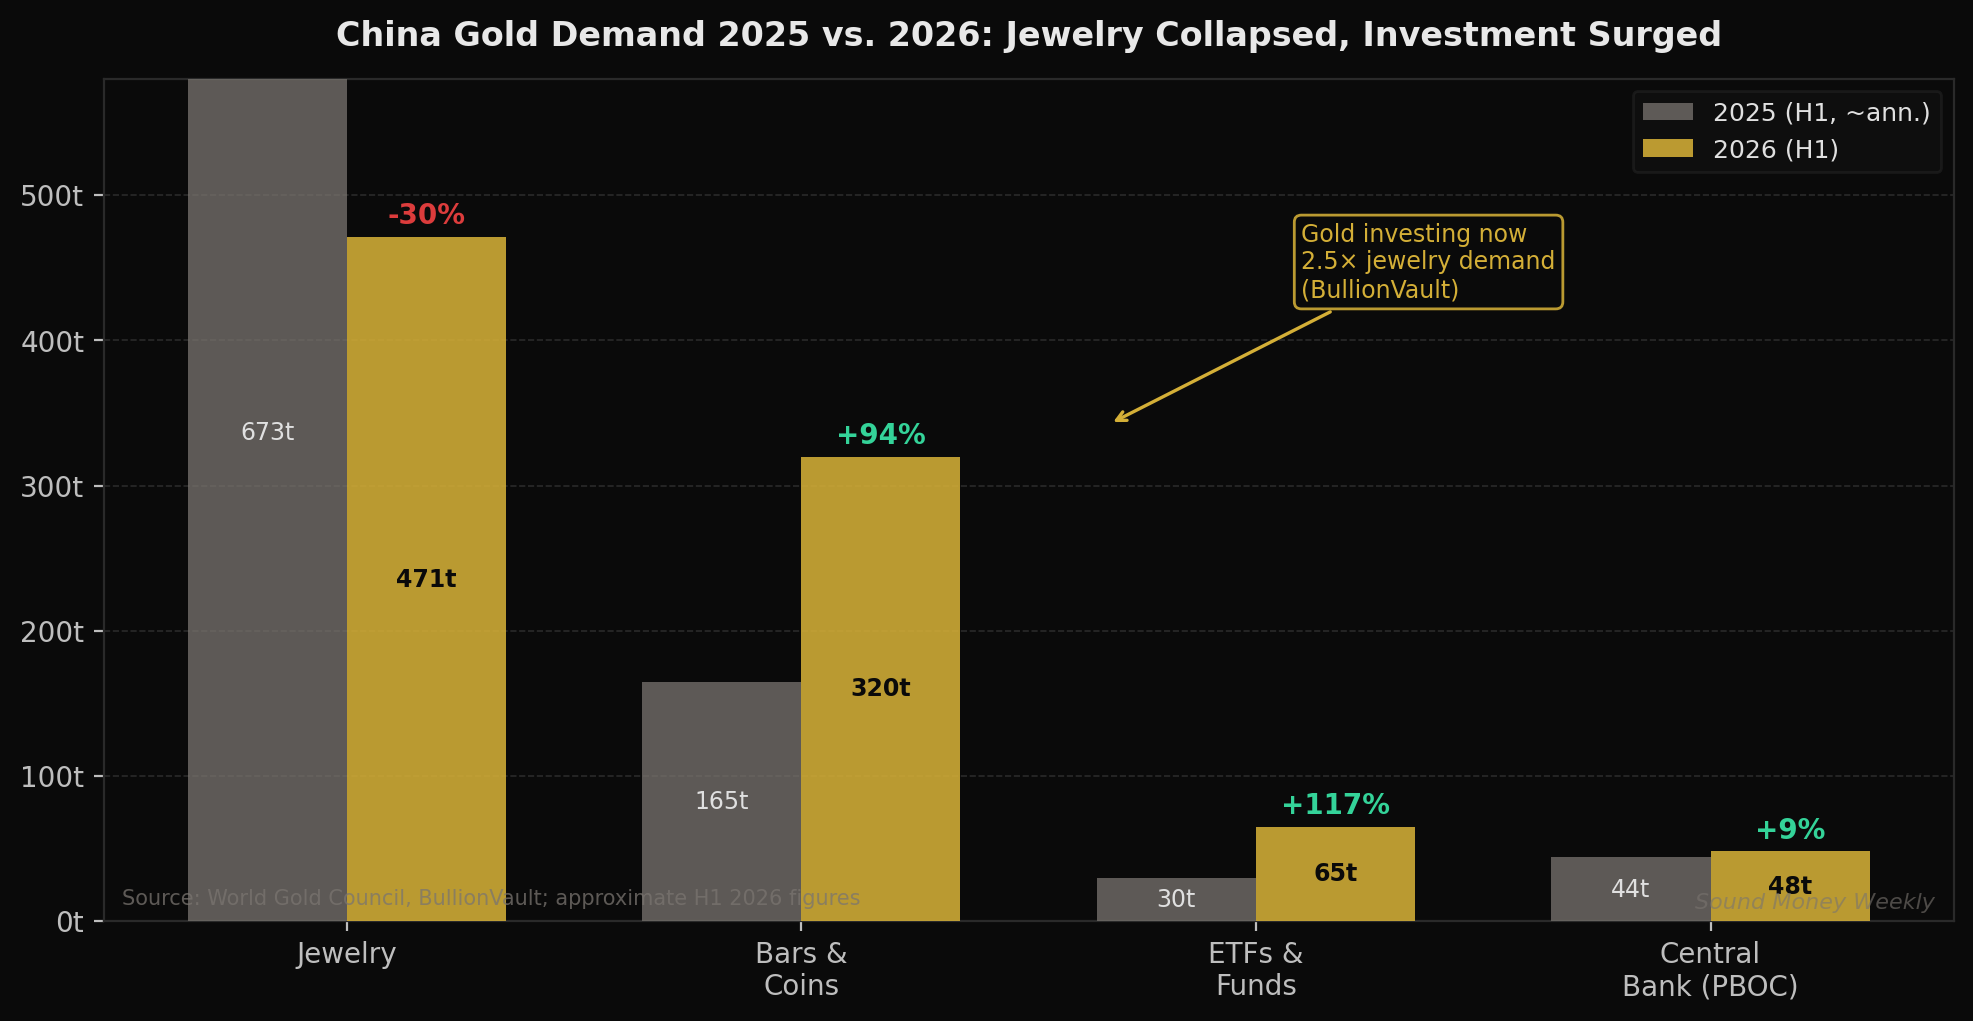
Chinese gold jewelry consumption has collapsed — down approximately 30% year-over-year in the first half of 2026. The highest gold prices in history — well above $4,000 and frequently above $4,500 — priced a significant portion of retail buyers out of the traditional jewelry channel. Fewer marriages (China's marriage rate has been declining for five consecutive years) compounded the effect.
But total Chinese gold demand by value reached a record high. How?
Because bar-and-coin investment in China is now running at 2.5 times the jewelry category. Chinese retail investors — many of whom were already comfortable with digital and fractional assets — shifted decisively from ornamentation to wealth preservation. Gold bars, gold coins, and investment accounts surged while necklaces and rings declined. The same high prices that suppressed jewelry demand validated gold's role as a store of value and attracted investment buyers.
The PBOC, meanwhile, continues its 22-month accumulation streak independently of retail. The structural demand from China is durable — it's just no longer in the category most Western observers track.
What This Means for the DCA Investor
The week that just ended resolved the single biggest uncertainty hanging over gold and silver since Warsh took over: will the Fed hike? It did. Is it the start of a cycle? The dot plot says no — one more in December, then a pause.
That's a different environment than the open-ended tightening scenario that markets were pricing in late August. And it's the environment gold has historically performed well in: after a defined terminal rate, with eventual cuts a few meetings away on the horizon.
DCA math at $4,360:
- $200/month buys 0.04587 oz — still 28.6% more gold than January's $5,608 all-time high
- Over 12 months: 0.5505 oz accumulated on $2,400 invested
- At Goldman's $4,900 year-end target: worth $2,697 — a +12.4% return on contributions
For silver at $66.75:
- The same $200/month buys 3.0 oz per month — and 36 oz per year
- At Citi's $75 six-month target: a $100 position per month built over six months delivers roughly $450 against $200 contributed: +125% on the silver side
The rate of return is secondary to the thesis: you're accumulating an asset with a structural supply deficit, growing central bank demand, and an improving macro backdrop as the rate cycle approaches its terminal. The discount from January's ATH — still 22% — is the entry point the numbers above reflect.
What We're Watching
December FOMC (December 15-16)
The dot plot says the next hike comes in December. The December decision hinges entirely on two more CPI readings — October 15 and November 12. If either shows the 0.4% monthly acceleration was a one-month anomaly, the December hike odds will soften. If both print hot, December is as locked in as September was.
Gold's Post-Hike Pattern
Historically, gold's best months often follow the final rate hike of a cycle by 3-6 months. If December is the last hike, spring 2027 becomes the potential setup. That's not a short-term call — it's the framework that governs how to think about DCA positioning today.
Silver's GSR Compression
The gold-to-silver ratio dropped from 68.2:1 last Monday to 65.3:1 today. A move to 60:1 — historically the bottom of the GSR range in precious metals bull markets — would imply silver at approximately $72 at current gold prices. Citi's $75 near-term target embeds a ratio move to approximately 58:1.
China's Investment vs. Jewelry Shift
If investment demand is structural — and the demographics and price dynamics suggest it is — then China's total gold demand remains elevated regardless of the jewelry collapse. The WGC Q3 2026 data, due in late October, will confirm or complicate that thesis.
The Bottom Line
The Fed hiked to 4%. All 12 members voted yes. Warsh's framing was "timelier return" — not open-ended tightening. The dot plot maps one more December hike, then a pause. Gold dipped 30 minutes, then recovered. Silver added 8% in two sessions.
The rate uncertainty that has weighed on precious metals since Warsh's Jackson Hole speech has a defined answer now: one more hike at most, terminal rate 4.25%, then hold. The December decision depends on October and November CPI. Until then, gold at $4,360 and silver at $66.75 reflect markets that have absorbed the first Warsh hike and are recalibrating for what comes next.
This article is for informational purposes only and does not constitute investment advice. Past performance of gold and silver prices is not indicative of future results. Always conduct your own research and consult a qualified financial advisor before making investment decisions. Sound Money provides fractional precious metals ownership services — see sound.money for full terms and conditions.
- gold
- silver
- precious-metals
- federal-reserve
- fomc
- rate-hike
- warsh
- china