Markets were quiet last week. Central banks were not. While gold recovered steadily to $4,695, the world's reserve managers were quietly confirming one of the most important structural stories in precious metals.
244 Tonnes: The Quiet Quarter That Speaks Louder Than Any Rate Decision
Sound Money Weekly | May 11, 2026
The Hook
Every week the gold market generates noise: price moves, Fed commentary, geopolitical signals, analyst upgrades and downgrades. Most of it is signal-to-noise ratio of about 10%. The data released by the World Gold Council this month is not noise.
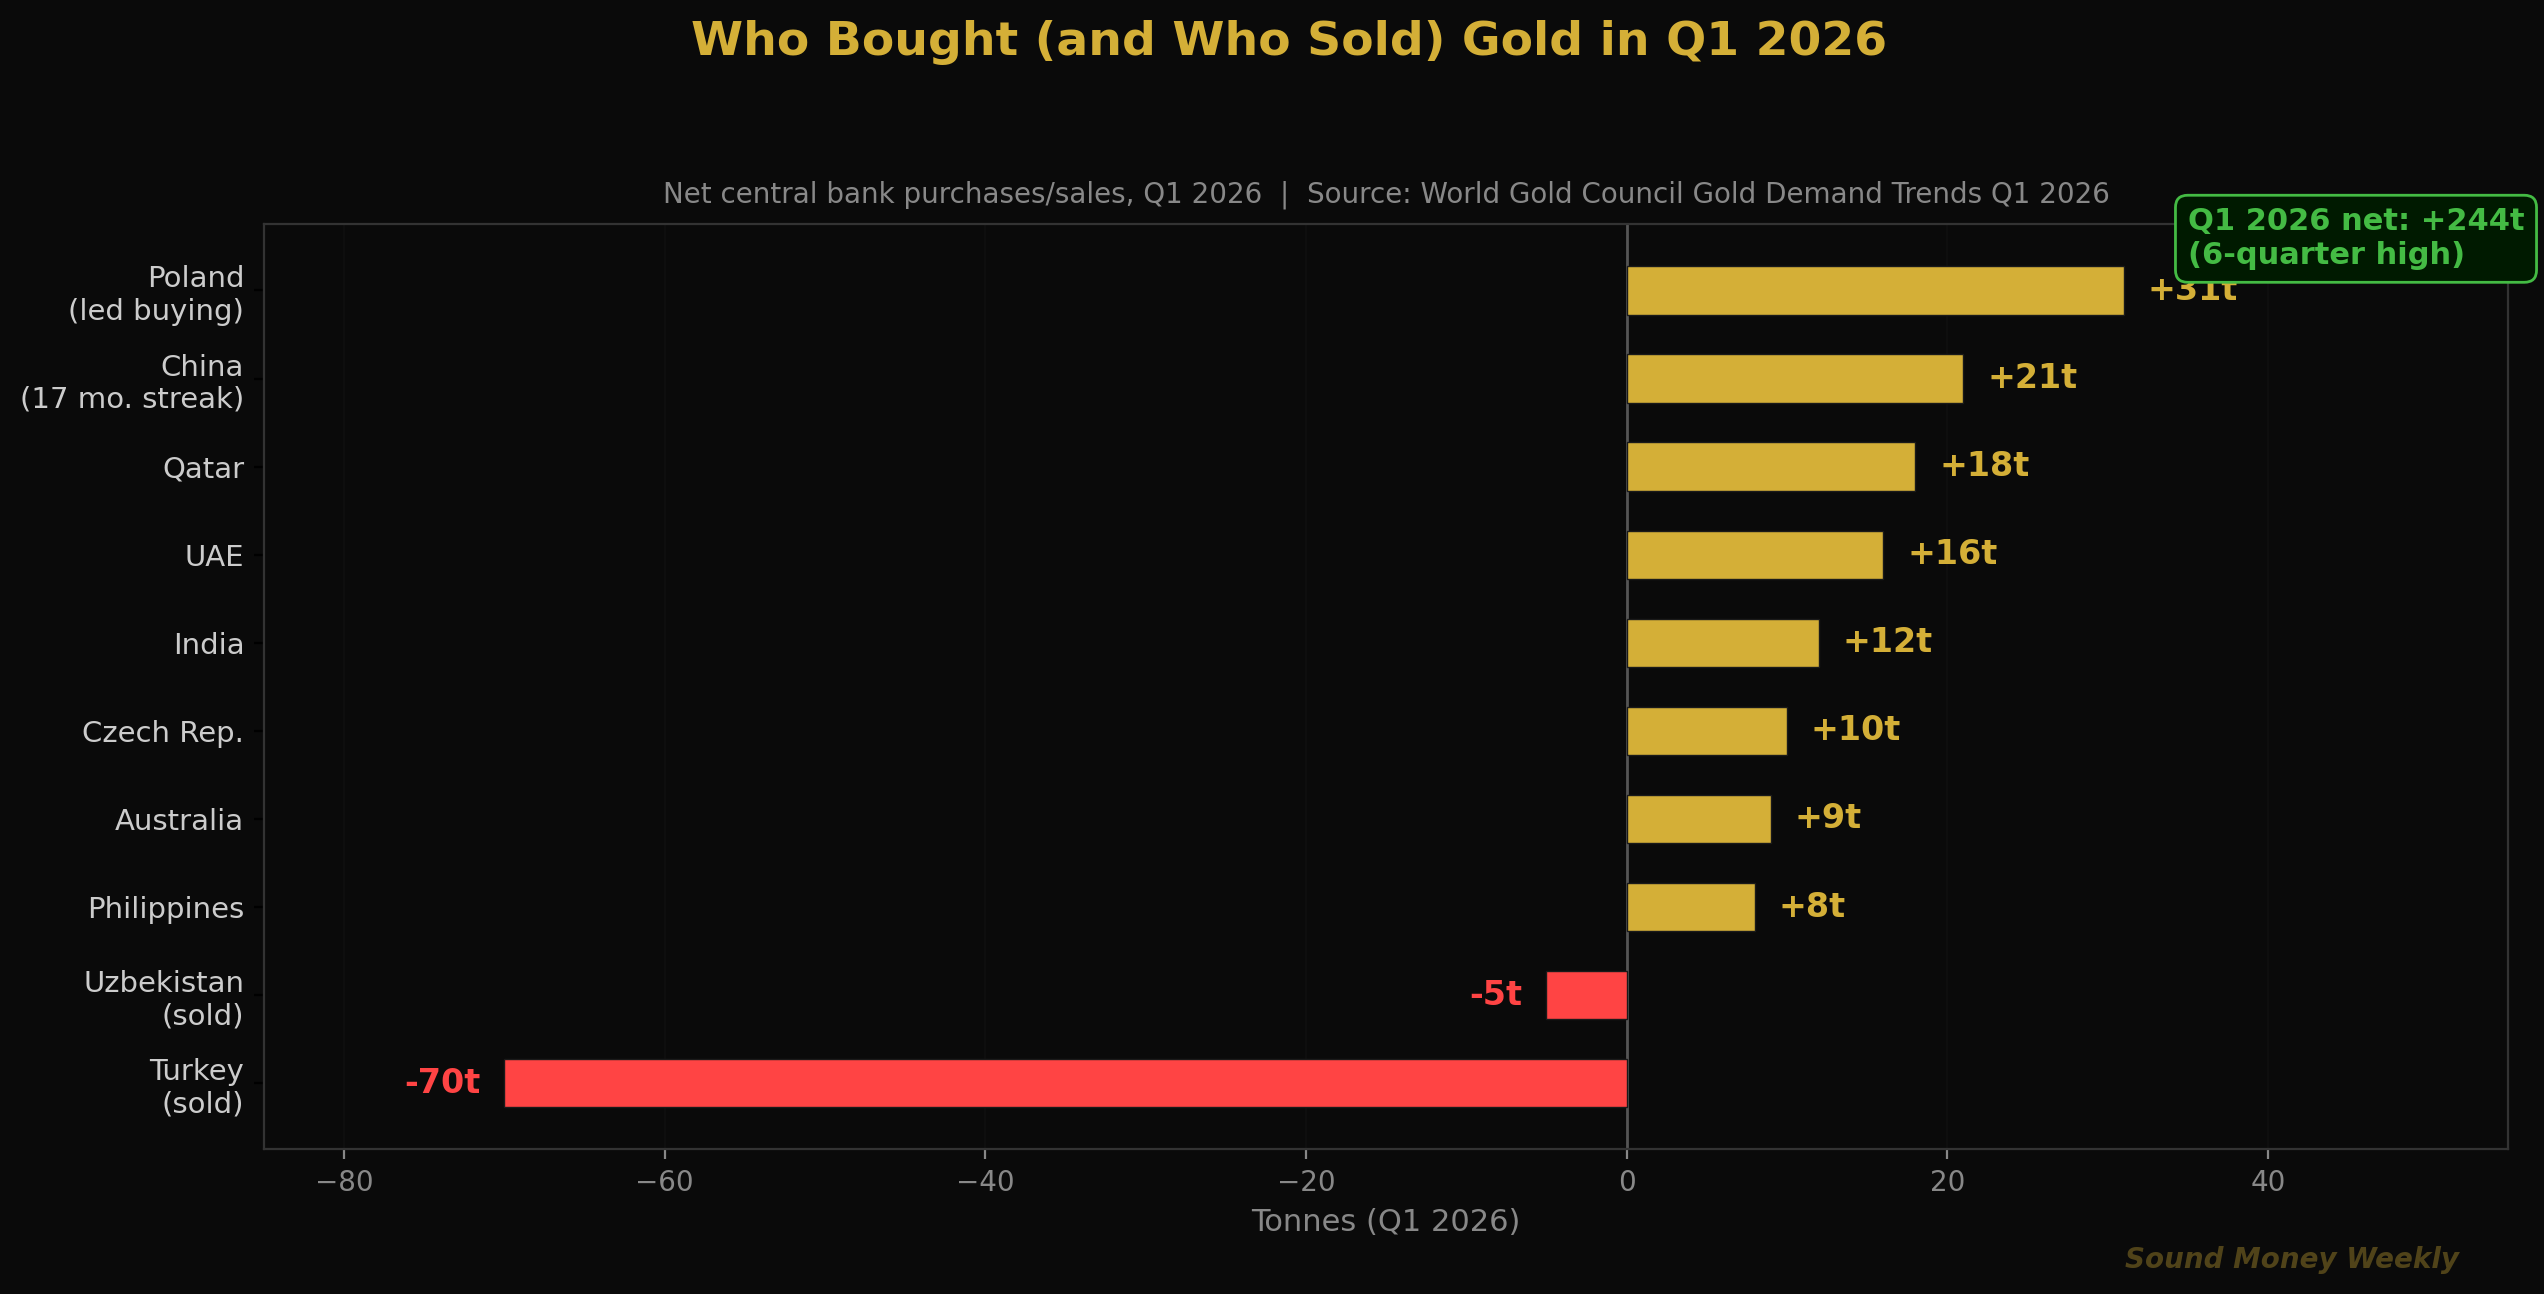
In the first quarter of 2026, global central banks purchased a net 244 tonnes of gold -- the highest quarterly net buying since late 2024 and the tenth time in the last eleven quarters that net purchases exceeded 200 tonnes. These are the institutions with the most sophisticated reserve management teams on earth. They operate on decade-long time horizons. They do not buy 244 tonnes of gold because they are reacting to a news cycle.
Here is the part nobody focused on: Turkey sold approximately 70 tonnes in Q1 -- the largest single-country sale in the quarter. It was the biggest central bank gold sale in years. It made headlines in commodity circles.
Gold did not flinch.
The price absorbed a 70-tonne official sale without even a meaningful drawdown, because the rest of the world's central banks -- Poland, China, India, UAE, Qatar, Czech Republic, Australia, and others -- were buying at a pace that overwhelmed it. That is what structural demand looks like. Not a trend that breaks when a single seller enters the room. A trend so durable that a 70-tonne sale is a footnote.
This is the data week. The market price action was secondary.
What the WGC Q1 Data Actually Shows
The WGC's Gold Demand Trends Q1 2026 report tells a story in three parts.
The Seller: Turkey's 70-Tonne Liquidity Move
Turkey's central bank sold approximately 70 tonnes in Q1. This was not a repudiation of gold. Turkey has done this before -- in early 2023 it also sold substantial reserves -- and the reason is almost always the same: domestic demand. When the Turkish lira weakens and Turkish citizens rush to exchange currency for gold, the central bank often satisfies that demand by drawing down its own reserves. It is a liquidity management tool, not an investment thesis change.
The reveal: Turkey's total gold holdings remain near historically high levels relative to their overall reserves. They sold the top of a position that they built during the previous years of aggressive buying. And while they sold, they were replaced by buyers with longer time horizons who never sell.
The Buyers: Poland, China, and the Structural Accumulators
Poland: 31 tonnes in Q1, bringing total reserves to approximately 600 tonnes. Poland's gold reserve strategy is now one of the most explicitly articulated of any central bank on earth. Their governor has publicly stated a target of 700+ tonnes, representing approximately 35% of FX reserves. For context: Poland shares a land border with Russia. They watched $300 billion in Russian dollar reserves be frozen with a single sanctions decision. They are not buying gold because of gold market conditions. They are buying gold because they have concluded that sovereign wealth stored in any other institution's liability carries political risk.
China: +5 tonnes in March -- the 17th consecutive monthly purchase. China's PBOC now holds 2,313 tonnes, representing 9% of its total foreign exchange reserves. The detail worth noting: China's gold share actually slipped slightly in percentage terms because the total reserve base grew. They kept buying anyway. The pace has been methodical and unbroken -- not a speculative bet on near-term prices, but a systematic reweighting of the world's largest foreign exchange reserve. That is not a trade. That is strategy.
The Rest: India, UAE, Qatar, Czech Republic, and Australia all added to reserves in Q1. The WGC data shows that central banks have now exceeded 200 tonnes of net quarterly purchases in 10 of the last 11 quarters.
The Trend: 18 Consecutive Years
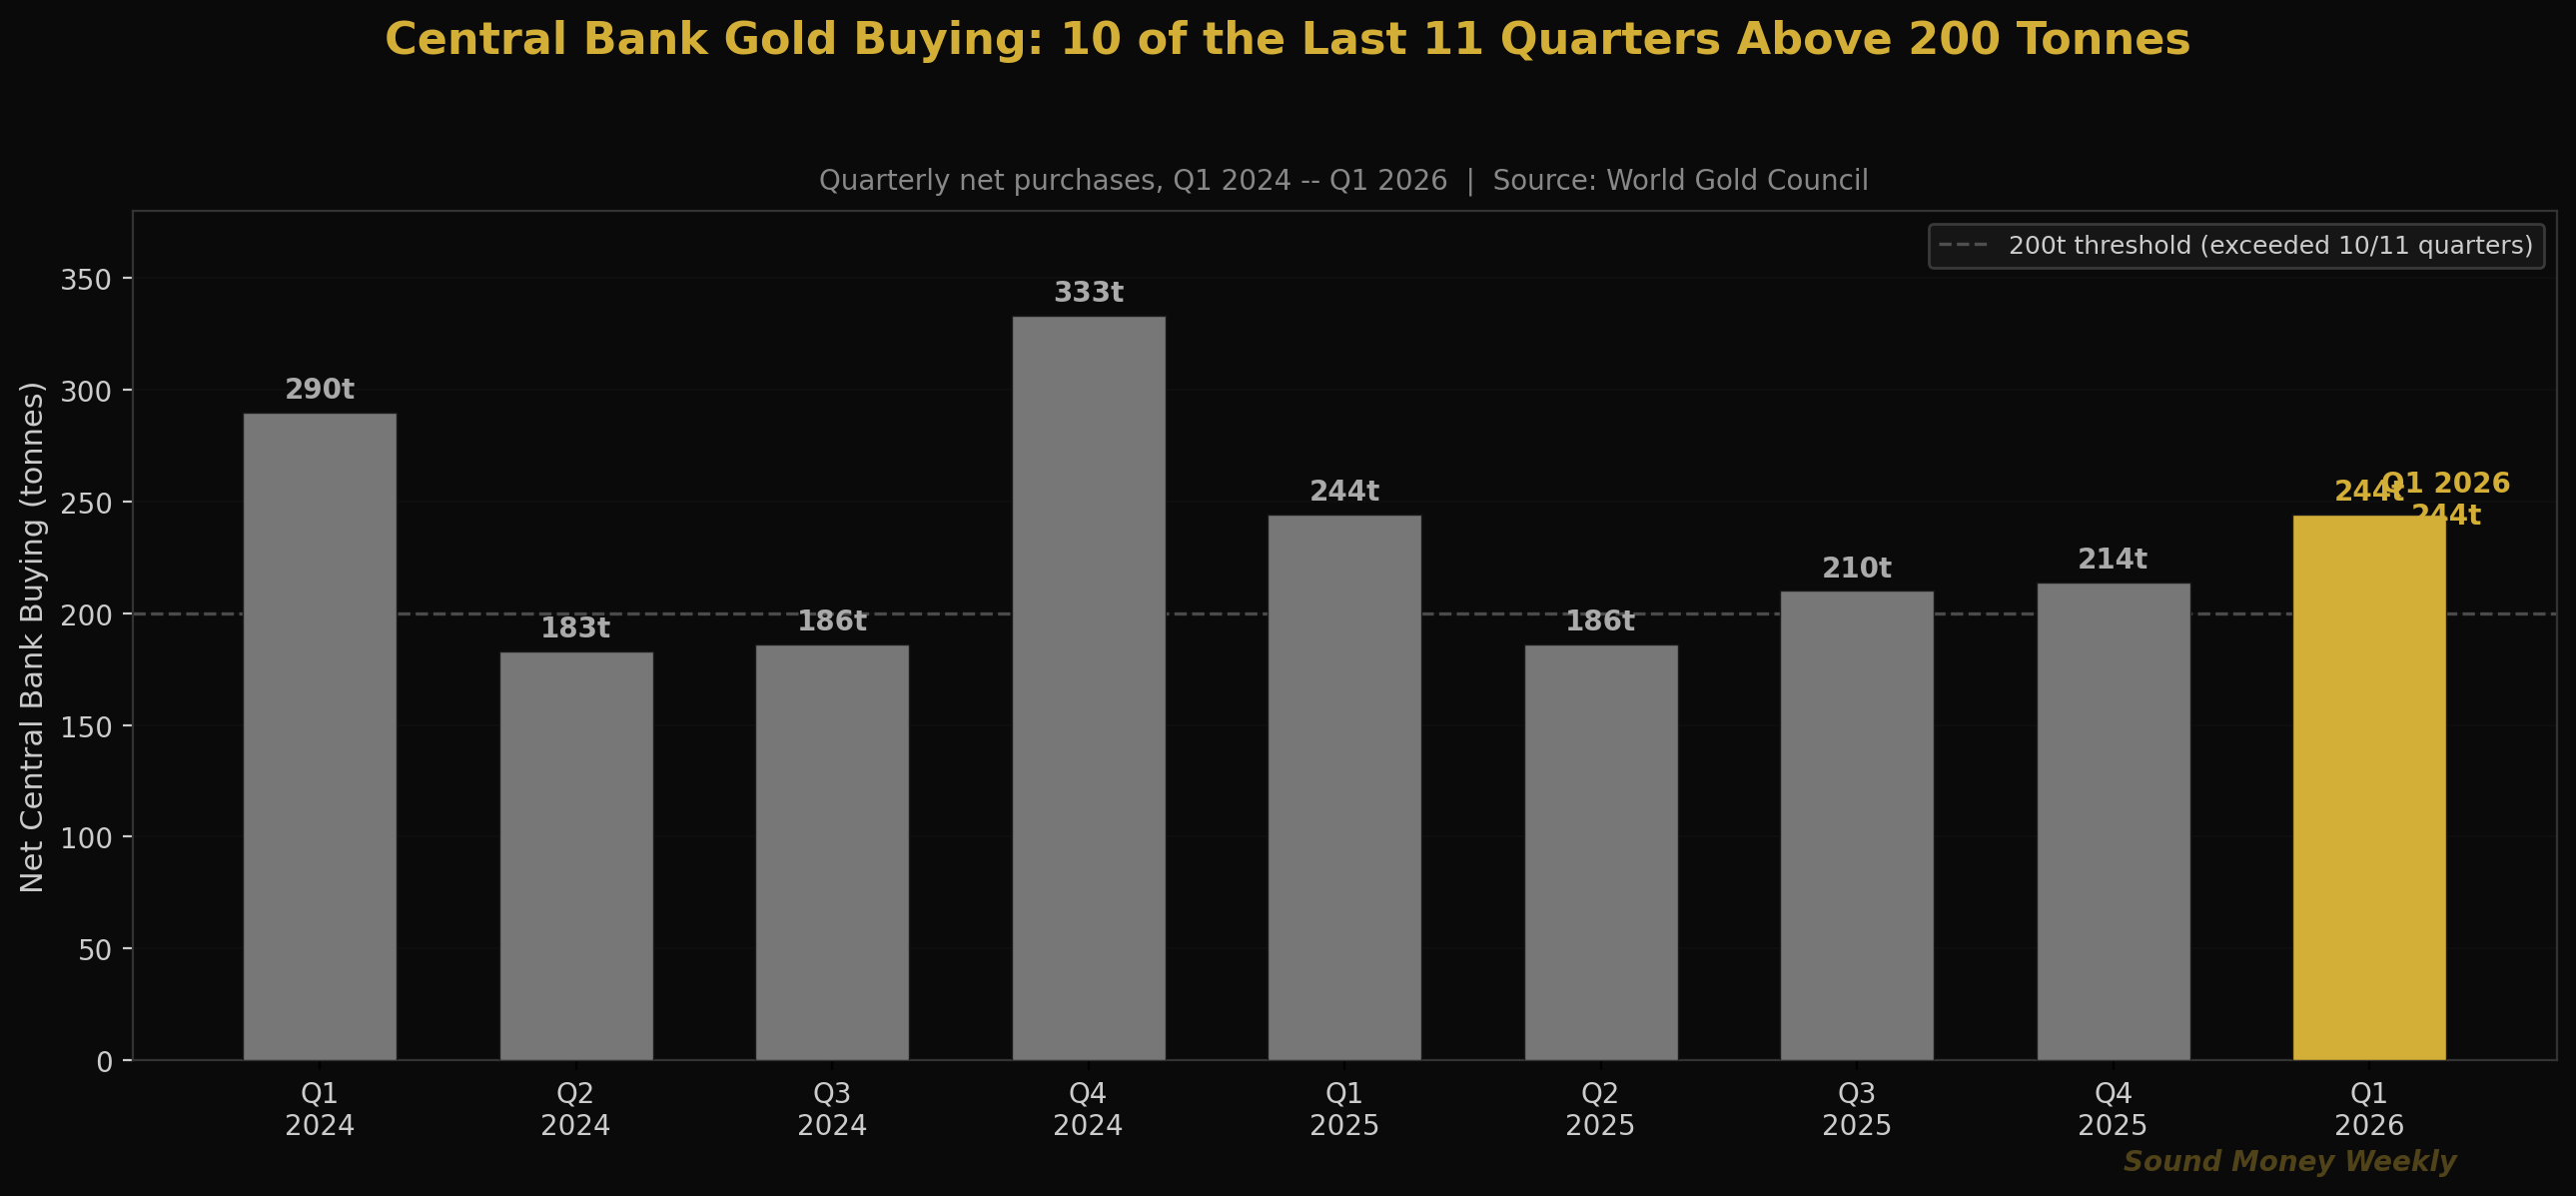
Central banks have been net buyers of gold for 18 consecutive years. That streak survived the 2008 financial crisis, the 2013 taper tantrum, COVID, the 2022 rate hike cycle, and the March 2026 selloff. Not one quarter in 18 years has produced a net sell. Q1 2026, with its Turkey headwind, maintained that streak at 244 tonnes net.
The Market Week: Quiet Recovery, Loud Catalysts Ahead
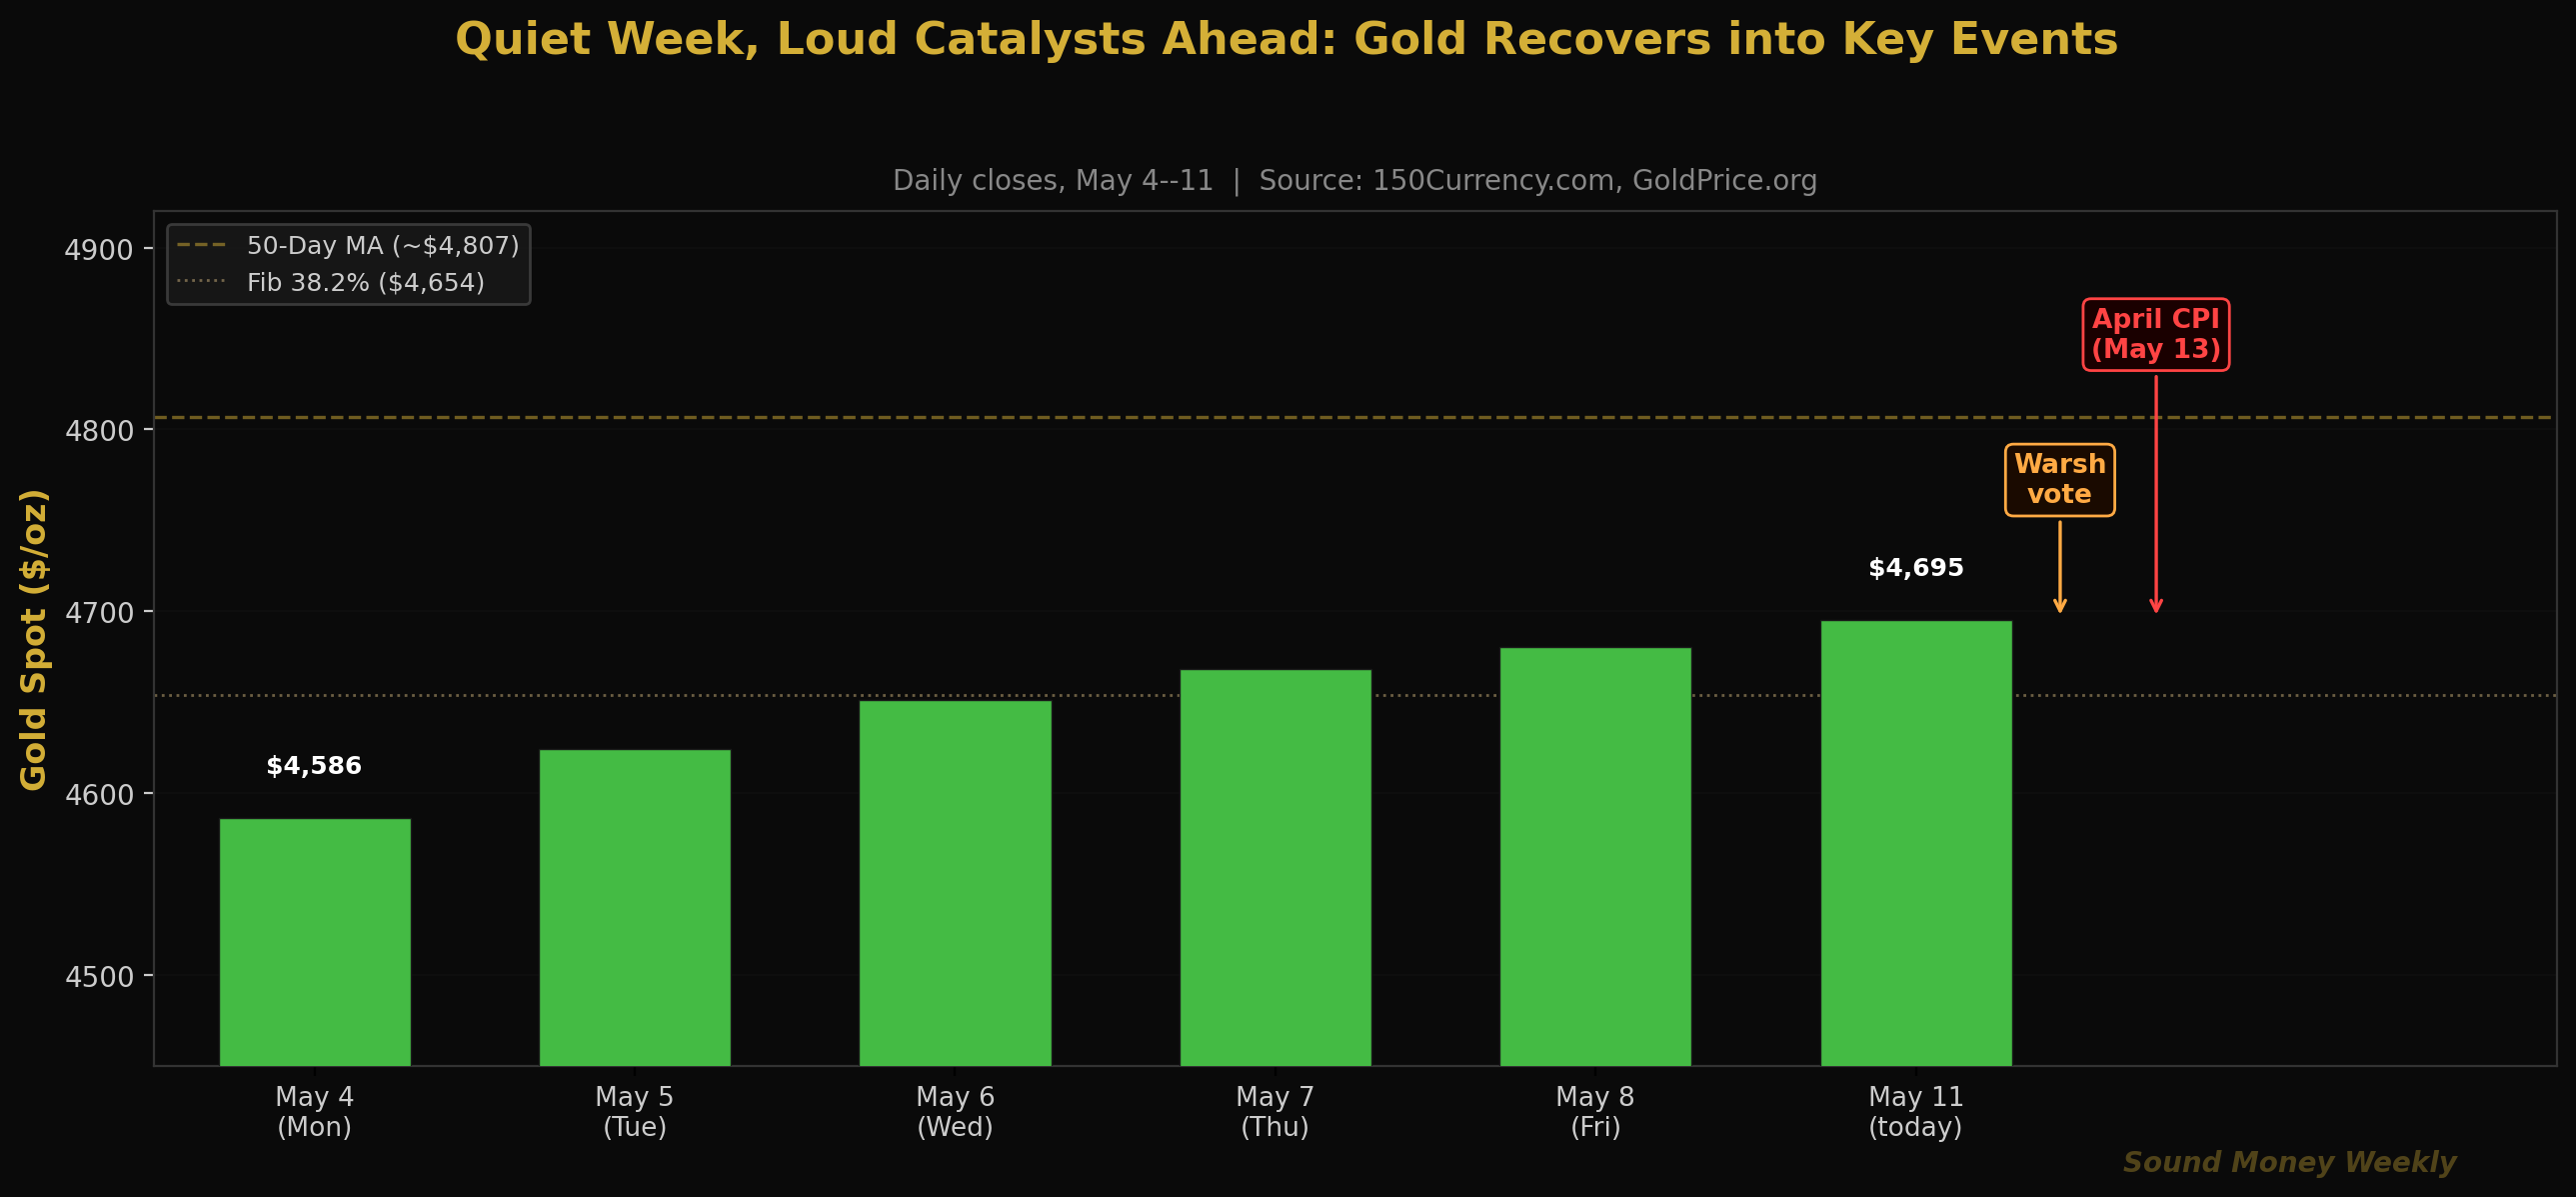
Gold's price action last week was straightforward: a steady $109 recovery from the FOMC-driven low of $4,586 to $4,695 this morning. Each session added between $20 and $30. No dramatic sessions, no threshold-crossing moves. Silver stabilized in the low $70s. The gold-silver ratio held near 63:1.
The quiet week is being followed by a noisy five days:
Today, May 11: The full Senate is expected to vote on Kevin Warsh's confirmation as Federal Reserve Chair this week. With Republicans holding a 53-seat majority, the confirmation is near-certain. Senator Fetterman (D-PA) has also indicated support, suggesting possible bipartisan confirmation.
Wednesday, May 13: April CPI. This is the data point the entire gold market has been waiting for since March's alarming 3.3% headline print. If Brent crude's retreat from $112 toward $90-95 has filtered into the energy component, the April print should drop sharply. A headline below 2.5% would reignite rate-cut expectations and give gold its first clear catalyst for breaking above the 50-day moving average at $4,807. A hot print (above 3.0%) would extend the hawkish ceiling.
Friday, May 15: Powell's term expires. Whether or not Warsh is confirmed by then, the institutional handover occurs. The market will watch for Warsh's first statements on press conference frequency, forward guidance, and balance sheet direction.
Under the Hood: Technical View
Gold at $4,695 sits in a well-defined zone:
| Level | Price | Note |
|---|---|---|
| 50-Day MA (resistance) | ~$4,807 | First major overhead target; Wednesday CPI could push through it |
| Current | $4,695 | Recovering steadily; 6 consecutive positive sessions |
| Fib 0.382 (support) | $4,654 | Acting as technical support beneath current price |
| Fib 0.500 (structural floor) | $4,361 | Has not been seriously threatened since late March |
| 200-Day MA | ~$4,200 | Long-term bull/bear line; irrelevant at current levels |
Six consecutive days of gains heading into CPI week is the pattern of a market that has absorbed its correction and is coiling for the next move. The technical setup is constructive: the floor has held, the recovery is orderly, and the 50-day MA overhead provides a clear line of demarcation. A Wednesday CPI print below 2.5% with gold above $4,807 by Friday would be the clearest signal yet that the correction is fully over and the resumption phase has begun.
A Note on Mining Costs That Nobody Is Explaining Correctly
Here is a counterintuitive data point getting misread in most mining sector commentary: 2026 mining cost guidance is running 10-15% above 2025 levels for the average gold miner. The common interpretation: higher costs mean lower margins. The more accurate interpretation: roughly half of that increase comes from gold-linked royalties -- contractual payments to land owners or governments calculated as a percentage of the gold's selling price. When gold hits $5,608, royalty payments automatically increase. When gold retreats to $4,695, they decrease proportionally. The "higher cost" is not an operational problem. It is a mathematical artifact of higher gold prices embedded in the contractual structure. A miner reporting 12% "cost inflation" because gold royalties went up is, in a perverse way, delivering bullish news disguised as bearish language.
The DCA Math at $4,695
At $4,695 this morning, the consistent stacker's math continues to improve relative to the January all-time high:
| Entry Point | Price | Oz per $200 | Value at Goldman $5,400 |
|---|---|---|---|
| January ATH | $5,608 | 0.03566 oz | $192 |
| Today | $4,695 | 0.04260 oz | $230 |
| Last week | $4,586 | 0.04361 oz | $235 |
| March low | $4,098 | 0.04881 oz | $264 |
At $4,695, a $200 monthly purchase acquires 0.04260 ounces -- 19.4% more metal than the same purchase at January's high. Over 12 months of consistent $200/month stacking, that compounds to approximately 0.511 ounces. At Goldman's $5,400 year-end target, that is $2,760 -- a 15% return on $2,400. At J.P. Morgan's $6,300, it is $3,219 -- a 34.1% return.
The Q1 central bank data provides the structural context for why these bank targets exist and why they have not moved since the March crash. Central banks are buying 244 tonnes per quarter. That is not a number that gets revised down without a fundamental change to the monetary landscape. The monetary landscape is not changing. The debt load is not shrinking. The reserve diversification trend is not reversing.
The people who kept stacking through the March selloff, through the Powell exit, through every week without a clear catalyst, are now positioned ahead of what could be the most decisive week in the gold market since the ceasefire bounce in early April.
The winners in this game are always in the game.
What It Means
Here is the plain-English version.
The Q1 central bank data is the most important gold story of the month. Not because 244 tonnes is a record -- it isn't -- but because it maintained the 10-of-11-quarters streak above 200 tonnes even after Turkey sold 70 tonnes. The trend is durable enough to absorb a major seller without any visible impact on price. That is structural demand, not speculative demand.
Turkey's sale is not a bearish signal. Turkey bought aggressively during 2021-2023, built reserves near historical highs relative to total FX reserves, and sold a portion when domestic demand required it. This is exactly what central bank gold management looks like when functioning properly. The metal moves from the reserve vault to domestic users; the overall level of gold in the monetary system does not change. The sellers become buyers again when the cycle turns.
China's 17-month unbroken buying streak is more important than any individual month. The PBOC is the world's largest foreign exchange reserve manager and one of the most sophisticated. They have purchased gold every single month for over a year, including months when gold prices were falling and the trade looked uncomfortable. That consistency reveals something about their long-term conviction that no single month's data can convey.
Wednesday's April CPI is the immediate catalyst. A print below 2.5% would be gold's strongest technical catalyst since the ceasefire on April 8. A print above 3.0% would extend the ceiling. Both scenarios represent a known binary outcome -- which is itself a form of clarity the market has not had since before the Iran conflict.
This is not a recommendation. We are not financial advisors and this is not advice. We observe that the world's central banks bought 244 tonnes of gold in a quarter when most individual investors were asking whether to pause their stacking. That contrast -- institutional accumulation running at 18-year consistency while retail nervousness peaks -- is historically one of the most reliable indicators in precious metals markets.
What We're Watching
Wednesday, May 13: April CPI (most important data point of the month). Energy drove 75% of March's alarming 3.3% print. Brent crude has retreated from $112 toward $90-95. The April read should be meaningfully lower. A headline below 2.5% would open the door to rate cut discussions at the June FOMC. Watch gold's reaction in the hour after the 8:30 AM release -- that immediate response will tell you more than a week of commentary.
This week: Full Senate Warsh confirmation vote. With a 53-seat majority and possible bipartisan support, confirmation is near-certain. Watch Warsh's first public statement as chair-designate for any hints on the policy direction of the June FOMC meeting.
May 15: Warsh handover. Jerome Powell's last day as chair. The institutional continuity of the Fed is not in question -- Powell remains as a governor. But the policy direction, communication style, and press conference cadence all shift. Markets have largely priced this. Any surprise language from Warsh this week could move metals.
China's 18th month. The WGC publishes updated monthly central bank data in the coming weeks. If the PBOC added gold in April, it will mark 18 consecutive months of purchases. That is not a streak that breaks without a policy-level decision from Beijing. Watch for it.
The $4,807 level. The 50-day moving average. Six consecutive days of gains heading into CPI week suggests the market wants to test it. A clean break above $4,807 on strong volume after a cooling CPI print would be the clearest technical confirmation of the next leg up.
Until Next Week
The 244 tonnes number from Q1 2026 will not make most headlines. It does not have the drama of a single-session gold move or a Fed rate decision. But it is more important than both.
Central banks have now been net buyers of gold for 18 consecutive years. They have exceeded 200 tonnes of quarterly net purchases in 10 of the last 11 quarters. They bought through the 2022 rate hike cycle. They bought through the March 2026 selloff. They bought through a quarter when Turkey sold 70 tonnes at peak prices.
These are not speculative positions. These are long-term judgments by the institutions responsible for the monetary stability of nations. They are buying gold because they have concluded -- not as a reaction to this week's data, but as a structural view over decades -- that gold serves a function in a reserve portfolio that no dollar-denominated asset can replicate: it cannot be frozen, it cannot be defaulted on, and it does not erode when its issuer runs $39 trillion in debt.
The individual stacker who bought $200 of gold in January, February, March, April, and today is doing exactly what the world's most sophisticated reserve managers are doing -- just at a different scale. At $4,695, each of those purchases acquired more ounces per dollar than the January ATH. That is the mechanism of DCA working in real time. Not because of a forecast. Because of a discipline.
Wednesday's CPI number will move markets. The 244 tonnes will move the longer arc. The winners in this game are always in the game. See you next Monday.
Sound Money offers fractional gold and silver ownership at whole-ounce pricing -- no minimums, no premiums. Learn more at sound.money.
Disclaimer: This content is provided by Sound Money for educational and informational purposes only. Nothing published here constitutes investment advice, financial advice, trading advice, or any other form of professional advice. Sound Money is not a registered investment advisor, broker-dealer, or financial planner. The information presented reflects our analysis of publicly available data and should not be relied upon as a basis for investment decisions. Precious metals investments carry risk, including the potential loss of principal. Past performance does not guarantee future results. Always consult a qualified financial advisor before making investment decisions. For more information, visit sound.money.
- gold
- silver
- precious-metals
- central-banks
- warsh
- china
- poland
- turkey
- cpi
- weekly-update